Assessing forest vulnerability to drought by intersecting modeled soil water availability with remote-sensing derived spectral anomalies
Background
The weather conditions in 2018 provide a large-scale drought experiment that offers the unique chance to test and adapt our models to these conditions. However, while the meteorological conditions showed similarities across Switzerland, the symptoms of tree water stress varied greatly in space. The question that imposes itself is:
When does a meteorological drought trigger a physiological drought?
Translation of a meteorological drought (high temperatures and lack of precipitation) into a physiological drought (a water deficiency not covering plant needs) is not straightforward since i) water needs of different plants vary, and ii) soils by their ability to retain and store water overprint the meteorological water availability pattern. Consequently, to predict physiological drought, it is essential to establish links between meteorology and soil hydrology, and between soil hydrology and plant water stress.
Preliminary results: linking soil moisture to vegetation indices
First intersections between soil moisture and vegetation indices resulted in four reactions to meteorological drought. Sites reacting with a significant decline in soil moisture, and vegetation indices (Figure 1 A) are considered as being highly vulnerable to physiological drought. On the other end of this spectrum, some sites retain a high level of soil moisture and vegetation index throughout the meteorological drought and therefore have a low vulnerability (Figure 1 D). Further, we observe sites with low drought resistance, e.g. even though the soil moisture remains on a relatively high level, there is a sharp drop in the vegetation indices (Figure 1 C). Vice versa sites with a high drought resistance retain the level of the vegetation index, although the soil moisture declines (Figure 1 B).
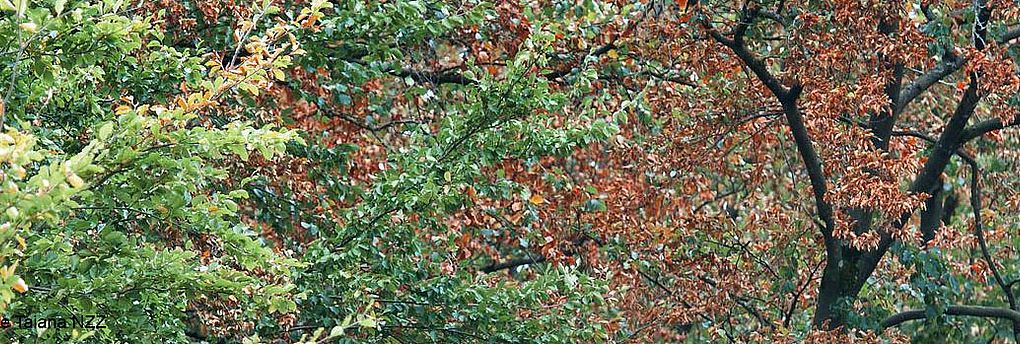
During the 2018 drought, the beech site Schänis (St-Gallen) is an example of the type A reaction (Figure 2, left). The soil water content started to decline on the 9th of July. Only two days later, the Normalized Difference Water Index (NDWI) which is indicative for the water content of leaves dropped. On the 8th of August, the soil water content and NDWI reached an absolute minimum that was not yet observed within the ten year monitoring period. Only beginning of September the soil water content was restored, however with no effect on the NDWI. The oak site in Novaggio (Ticino) on the other hand showed high resistance to the 2018 drought (type B). Here a distinct decline in soil water content was not followed by a decline in NDWI (Figure 2, right).
Through the application of the soil water balance model (LWFBrook90R), we will be able to upscale his analysis for more Swiss forest sites.

