MAPPING GOVERNANCE OF ADAPTATION TO CLIMATE CHANGE IN THE ALPINE SPACE
Background
The Alpine Space is severely affected by climate change. Adaptation to climatic change is needed to deal with climate related risks and to manage climate change impacts. National adaptation strategies are in place in some Alpine countries, but implementation is inhibited by multiple obstacles: Regional adaptation strategies and action plans are just emerging, adaptation has hardly entered local agendas, and policy mainstreaming is limited on all levels. Governance has a key role in the transition from adaptation strategies to implementation in practice, but capacities for multilevel, cross-sector governance of aaptation processes are lacking in all countries. Adequate governance designs and models are mostly still missing or not operational.
Governance of Adaptation to Climate Change
Governance of adaptation to climate change is defined as the structures, processes and interdependencies that determine how actors (from public administration, politics, science, business and civil society) make decisions, share power, exercise responsibility, and ensure accountability regarding adaptation to climate change. Governance is about the horizontal interplay of sectors and the vertical interplay of policy levels. It requires mandatory (formal) and voluntary (informal) cooperation between actors, across sectors and across policy levels and is regionally specific and context-sensitive.
Mapping Governance
Mapping governance of adaptation to climate change means identifying and visualizing the most relevant climate change adaptation activities. Methodologically, the mapping is based on expert assessments on the most relevant adaptation policies, measures, actors, knowledge resources, and interactions. We distinguish different types of interactions to represent the most important functions of governance: information, decision-making, implementation, funding, monitoring and evaluation.
Mapping governance of adaptation to climate change in the Alpine Space and visualizing those governance patterns and dynamics is essential in order to learn from the diversity of governance approaches taken in different countries and regions, to share strengths and weaknesses and to highlight options and innovations for enhancing vertical coordination and mainstreaming.
How to read the governance maps?
The visualization is divided into three main parts: 1) A main navigation, including a possibility to select a country, a search bar to search for specific entries and a list of items of the selected country, ordered by category. 2) A legend and filter navigation for specific filtering and analysis and finally 3) a map, as a visualization of the data.
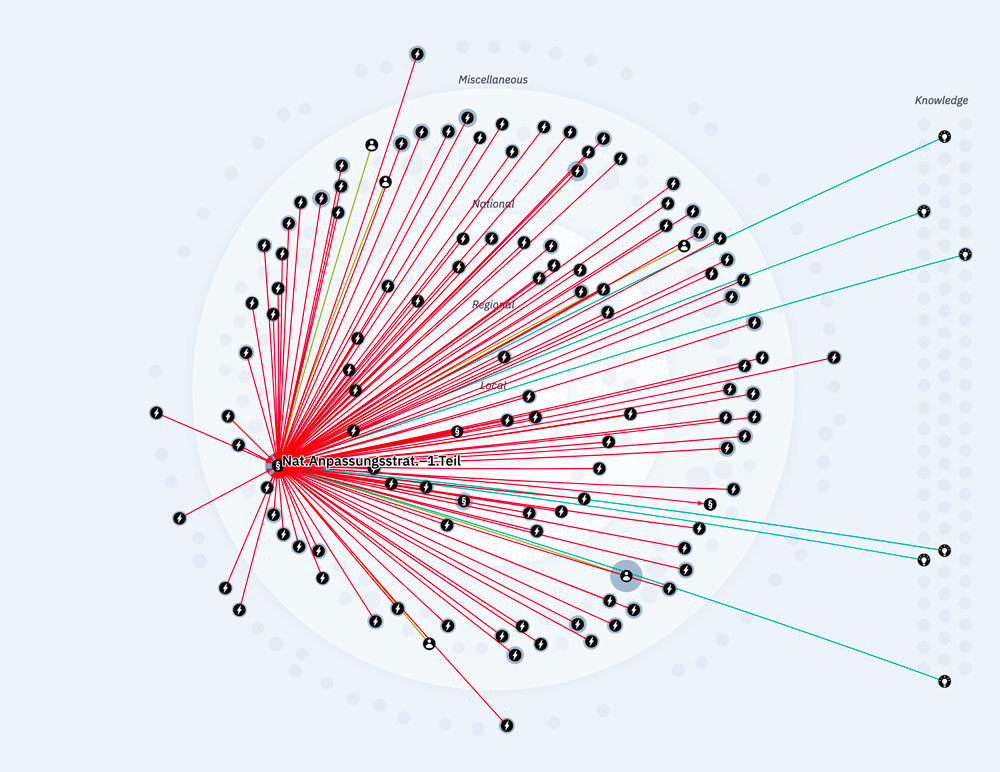
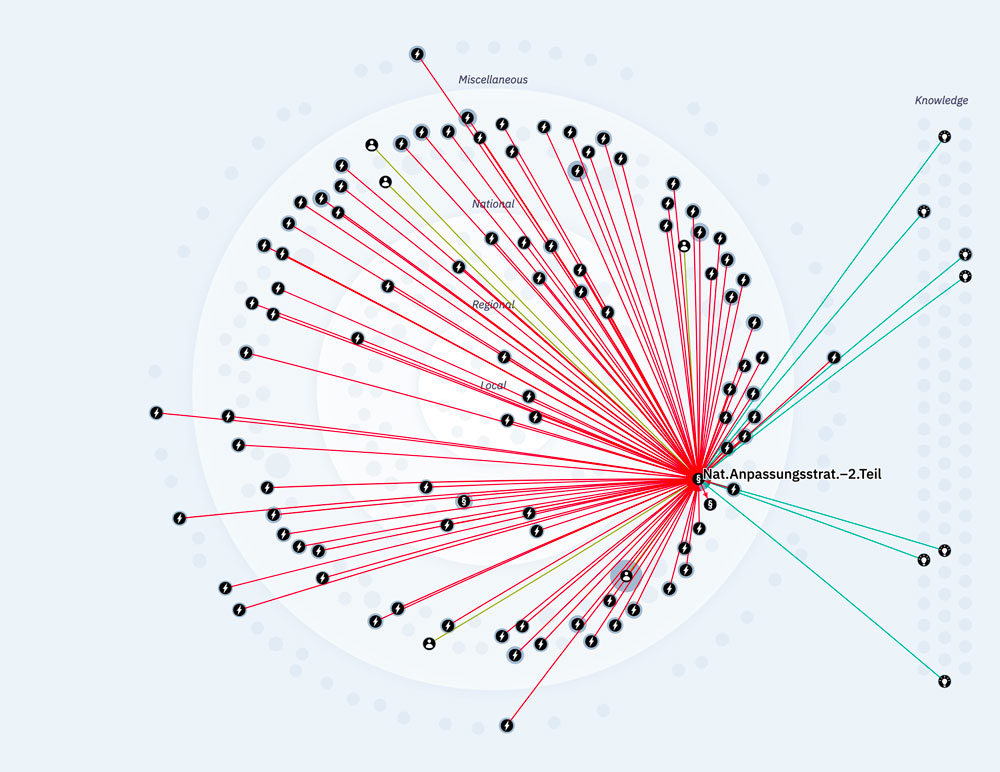
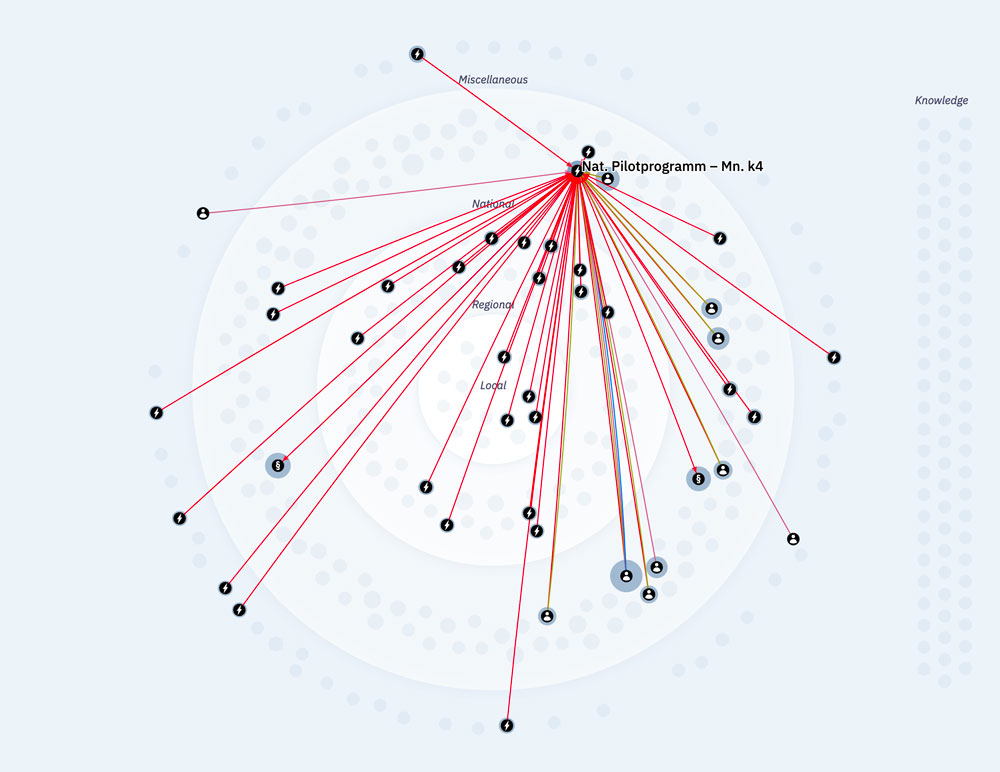
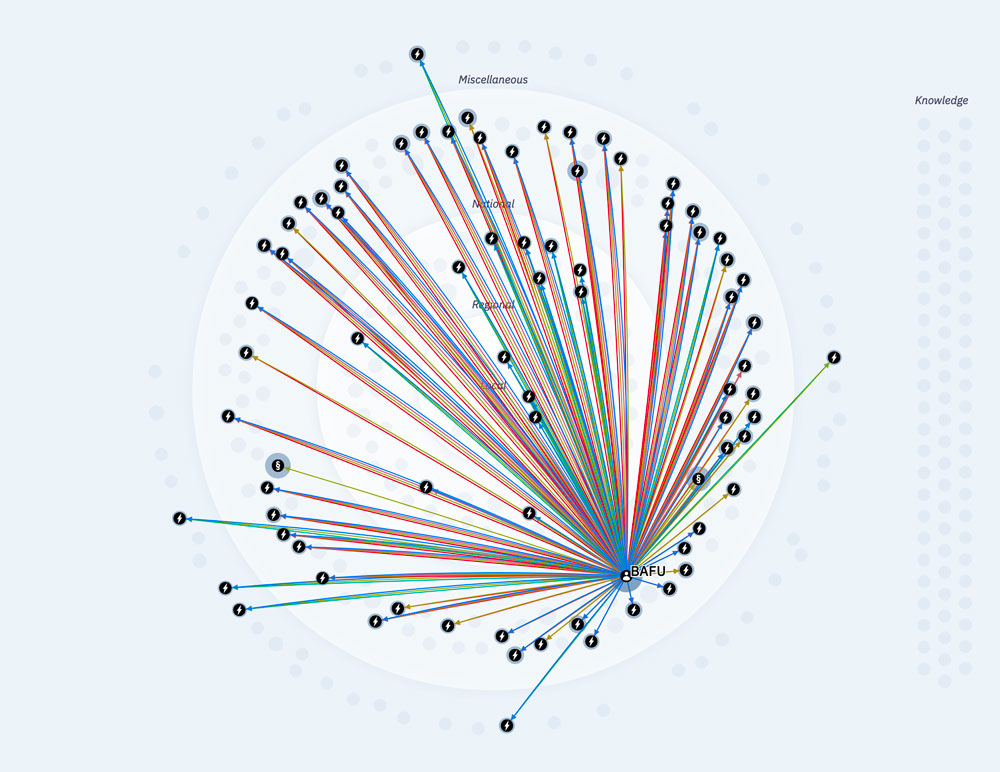
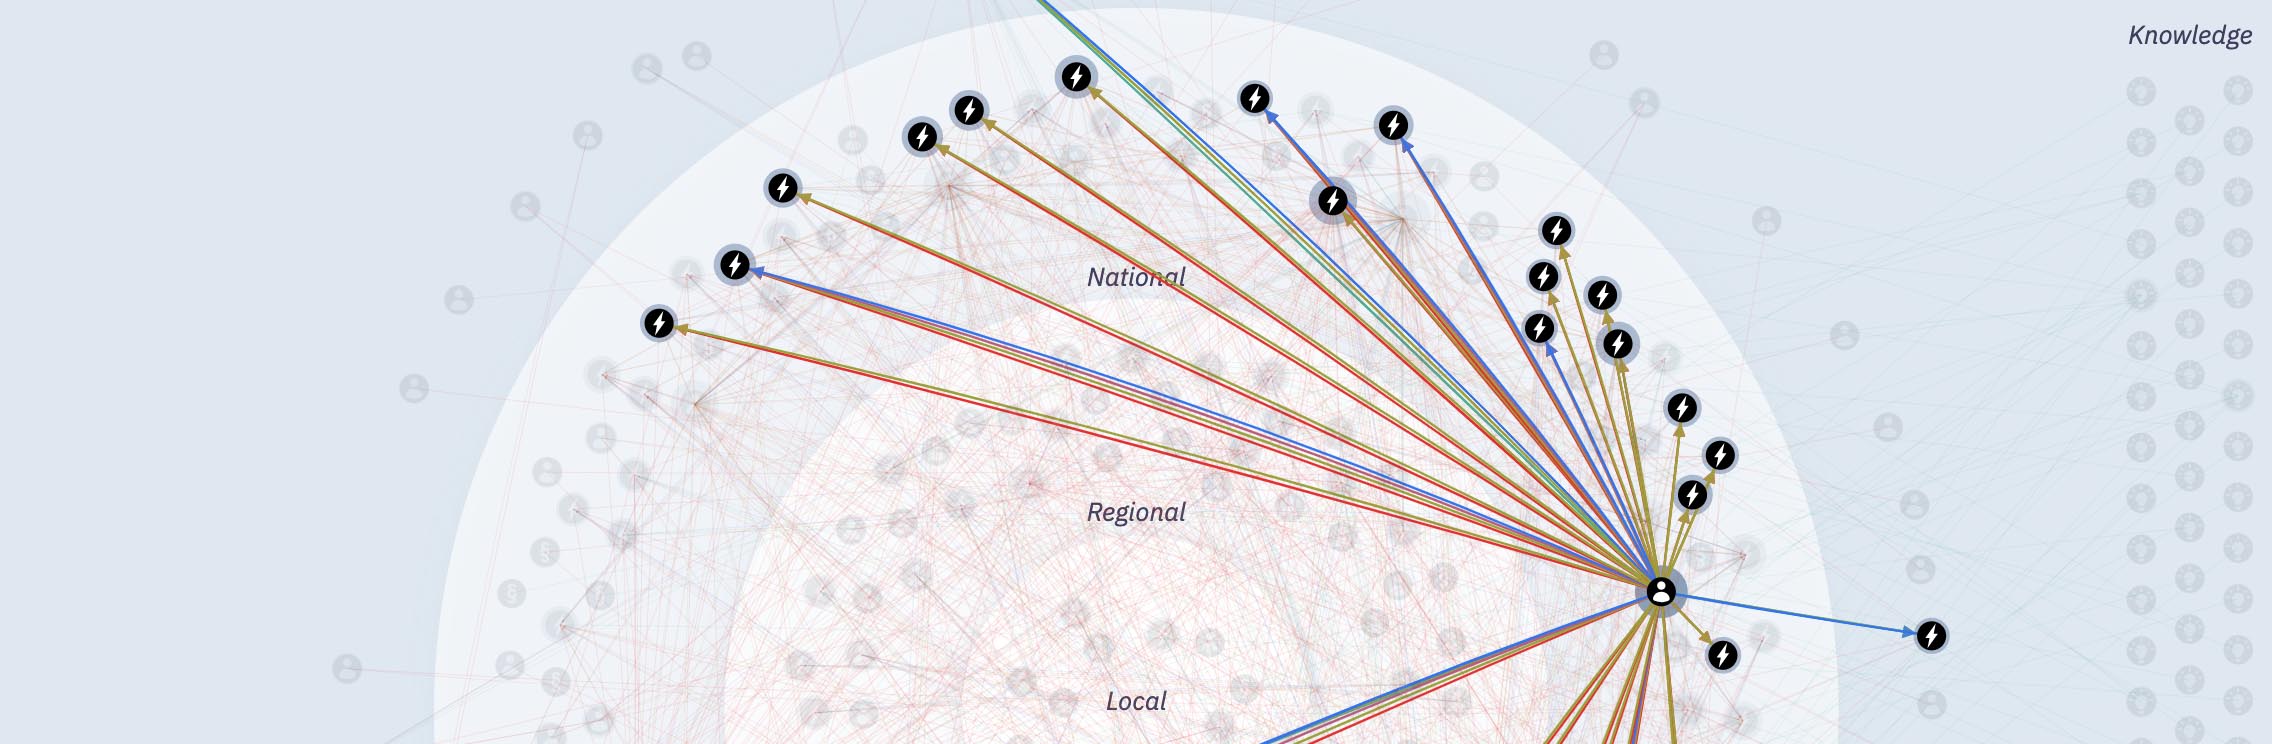
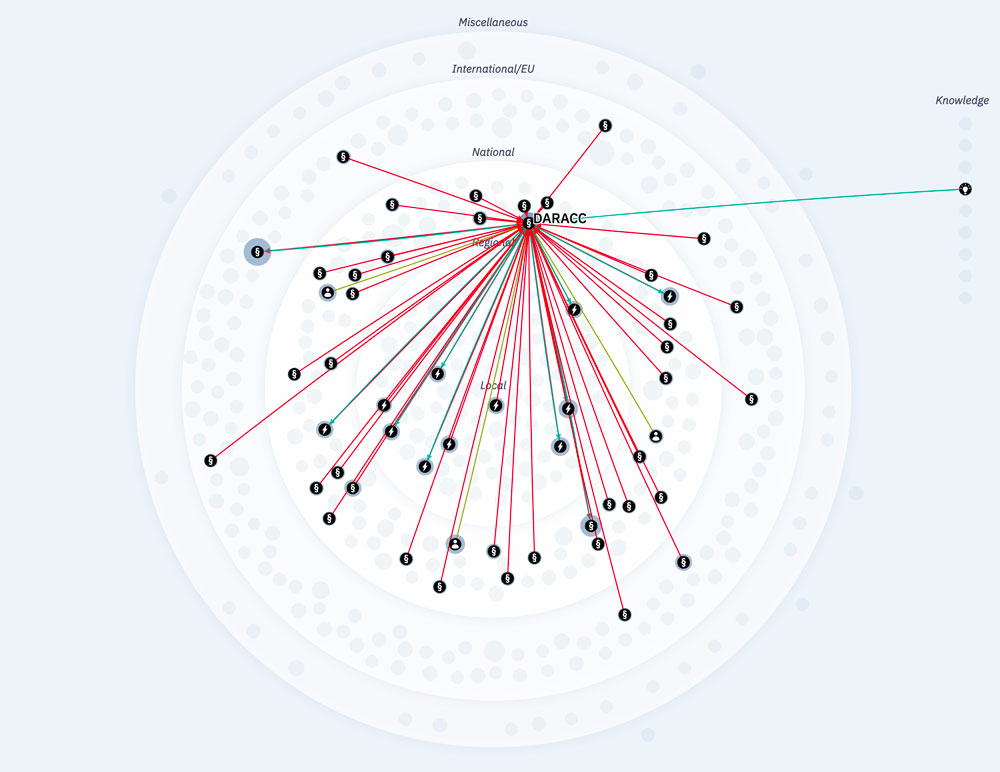
The map shows the different policies, measures and actors involved in the adaptation to climate change of a selected country on the international, national, regional and local level as well as important knowledge utilized or produced by these policies, measures and actors.

Actors, policies and measures are positioned according to their level (international, national, regional, local or miscellaneous) inside a map where each ring symbolizes one of the levels. Knowledge is positioned separated on the right of the visualization. (Note: spatial proximity between items inside the levels is random and not encoded with meaning)

Clicking on one of these items shows its interactions with other items as color-coded lines, divided into the 6 interaction categories »implements & implemented by«, »decides & decided by«, »informs & informed by«, »funds & funded by«, »reports/monitors/evaluates & reported/monitored/evaluated by« or »is part of network«. Little arrowheads show the direction of the different interactions.

The visualization of these interactions answers the following questions:
- Who or what implements which policies and measures?
- Who or what informs which policies, measures and actors?
- Who decides, funds and monitors which policies and measures?
Additional to the display of items by icons in the visualization, each item is listed in the entry list to the left, ordered by category. To select a specific item, you can either click on its icon or click on the corresponding entry in the list. Selecting an item will also open up a detailed description of the item and all its interactions in the list to the left. After an item is selected, related items can be accessed as well, by clicking on their link in the list or on their icon in the visualization. Furthermore, items can also be selected by using the search bar. To deselect an item again, just click anywhere on the background, click on "CLOSE DETAILVIEW" in the item list, click "Reset" in the filter navigation or click the cross of the search field.

For specific tasks or search interests, items can be filtered by time, level (international, national, regional, local and miscellaneous), category (policies, measures, actors and knowledge) or interaction type. To view only items conceived after a certain point of time or before a certain point of time, drag the buttons to the left and to the right of the timeline so they enclose the timespan you want to view. To utilize the other filters simply select them by clicking on them. Different filters can be combined freely. To reset all filters simply click on the “Reset Filters” button at the bottom of the filters window. By clicking the arrow to the right of the filters window, the filter navigation bar can be hidden to offer a better view on the visualization. Additionally, it's possible to move the visualization by dragging and to zoom in or zoom out by scrolling.
The strength of this visualization lies in the fact that it enables the user to view the data via an iterative exploration process: Simply start out by selecting an item or a set of filter that interests you and follow the highlighted interactions to other entries that catch your attention.
SELECT A COUNTRY AND EXPLORE THE DATA
OR READ AN INTRODUCTION FOR EACH COUNTRY AND DIVE INTO PRESELECTED EXAMPLES
Austria
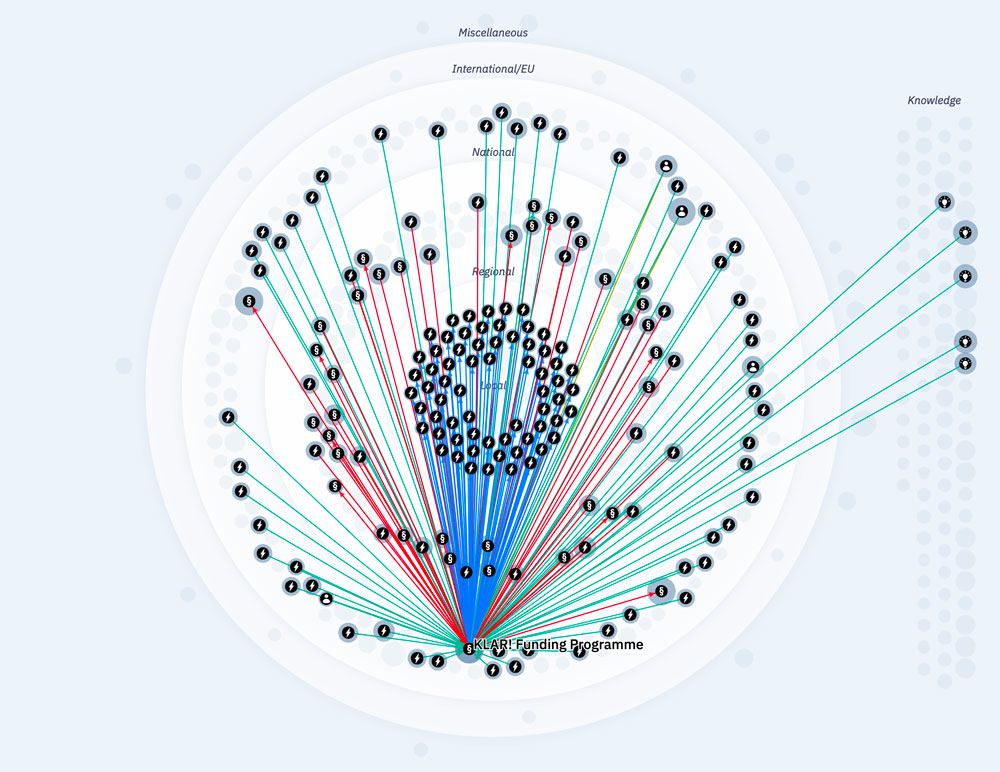
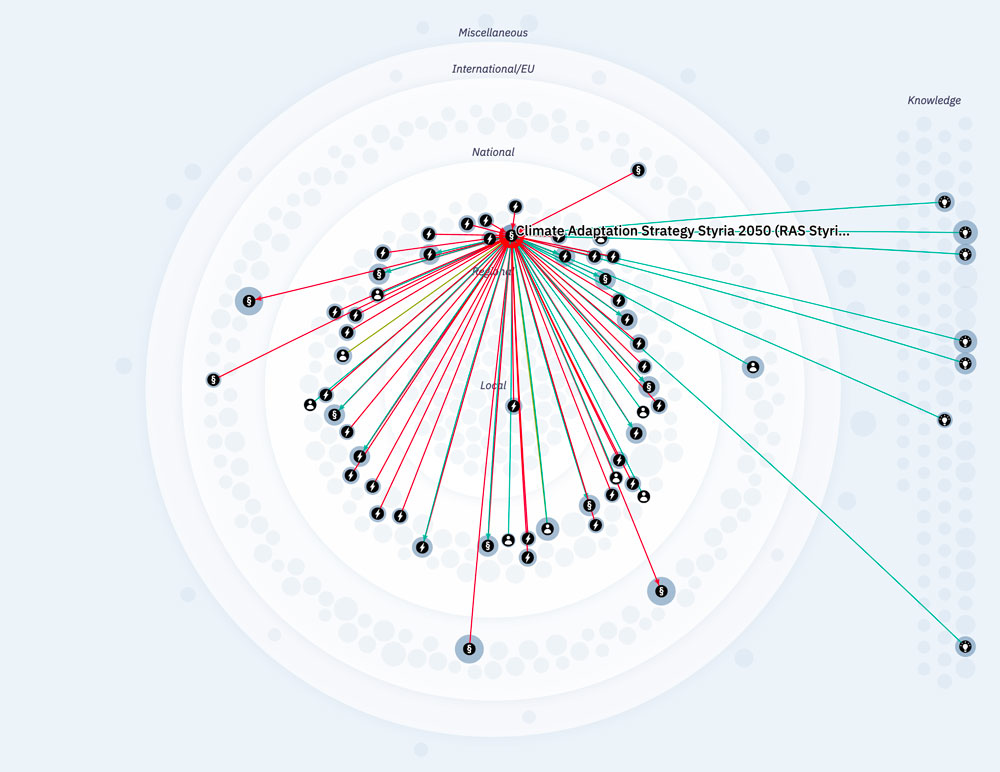
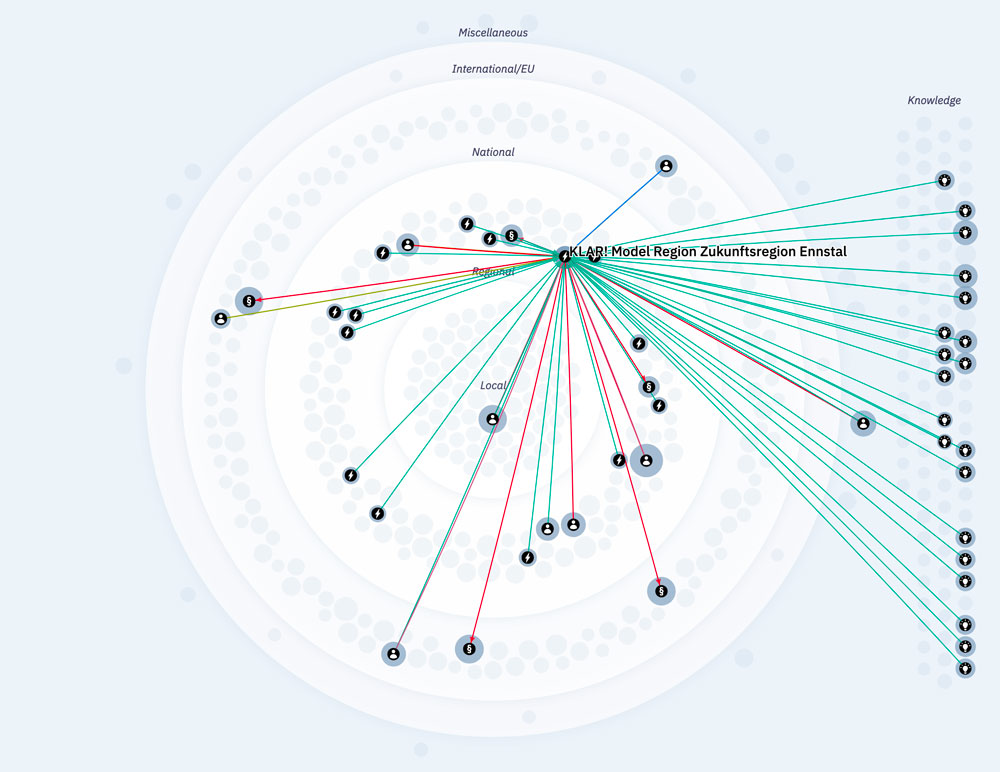
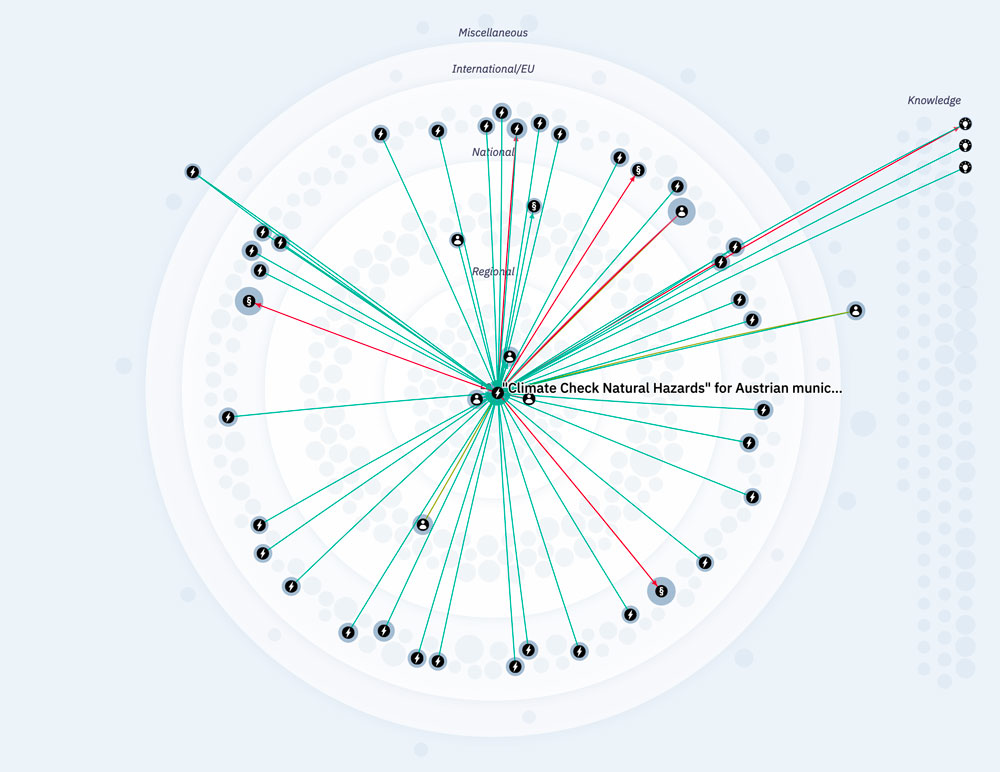
This visualization covers the Austrian climate adaptation governance landscape from a country-wide perspective. Starting out from the national adaptation strategy and action plan at federal level, the focus is thus on governance elements and processes that are of relevance for entire Austria. The regional adaptation policy processes in place in the nine federal states are covered as far as the level of regional adaptation strategies, climate adaptation model regions, and related actors and processes in all federal states. In addition, the mapping has a regional focus and a thematic focus, adding even larger depth of detail to selected areas of interest by means of a two-fold case study approach: i) to represent the complete multi-level governance chain from the federal down to the local level in an exemplary way, we mapped the adaptation governance landscape of one federal state by the example of Styria; ii) to shed light in an exemplary way on the mainstreaming of adaptation into a selected sector, we mapped in detail all measures related to natural hazard management and disaster risk reduction of the national and the Styrian adaptation strategy. For your easy entry in the adaptation governance landscape of Austria, we suggest starting with one of the following pre-selected governance items that are well-suited to start exploring the various dimensions outlined above. These are: the Austrian Strategy on Adaptation to Climate Change. Part 2: Action Plan - Recommendations for Action (NAP). Revised edition (2017) ; the KLAR! Funding Programme Climate Change Adaptation Model Regions; the Climate Adaptation Strategy Styria 2050; the KLAR! Model Region Zukunftsregion Ennstal in Styria; and the "Climate Check Natural Hazards" for Austrian municipalities.
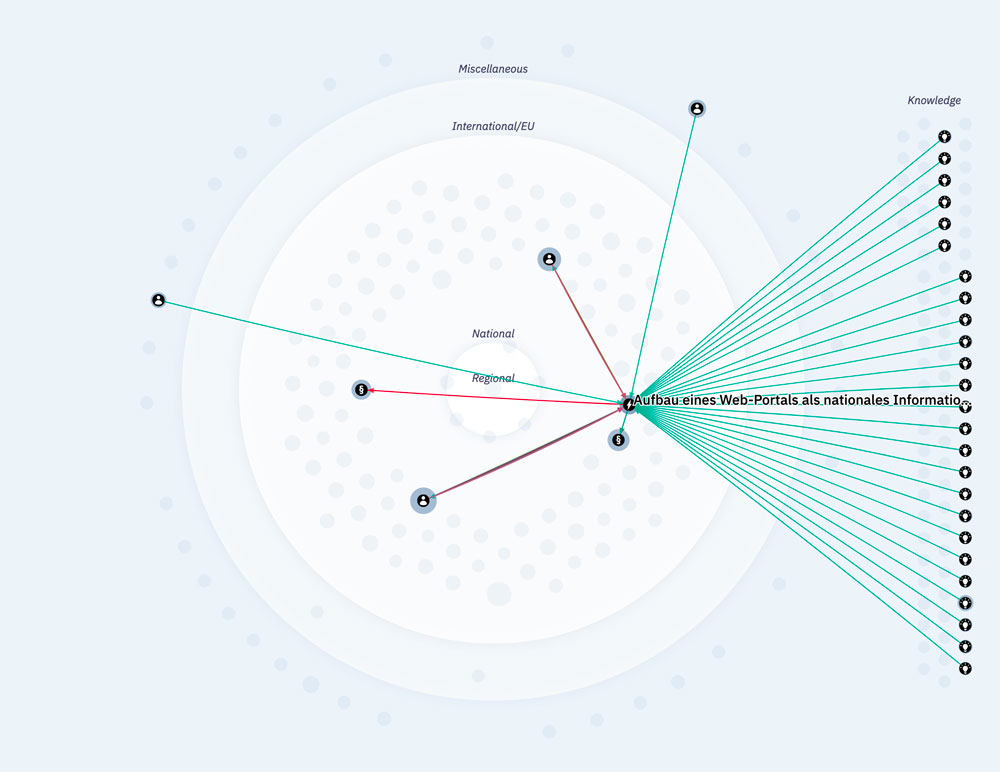
France
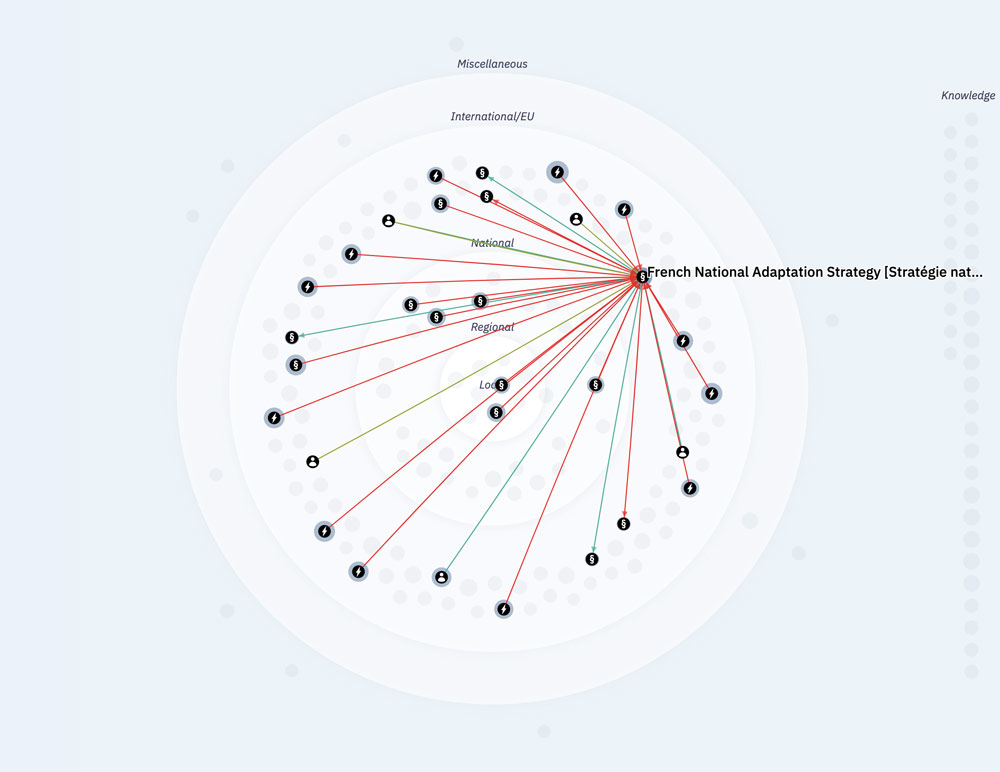
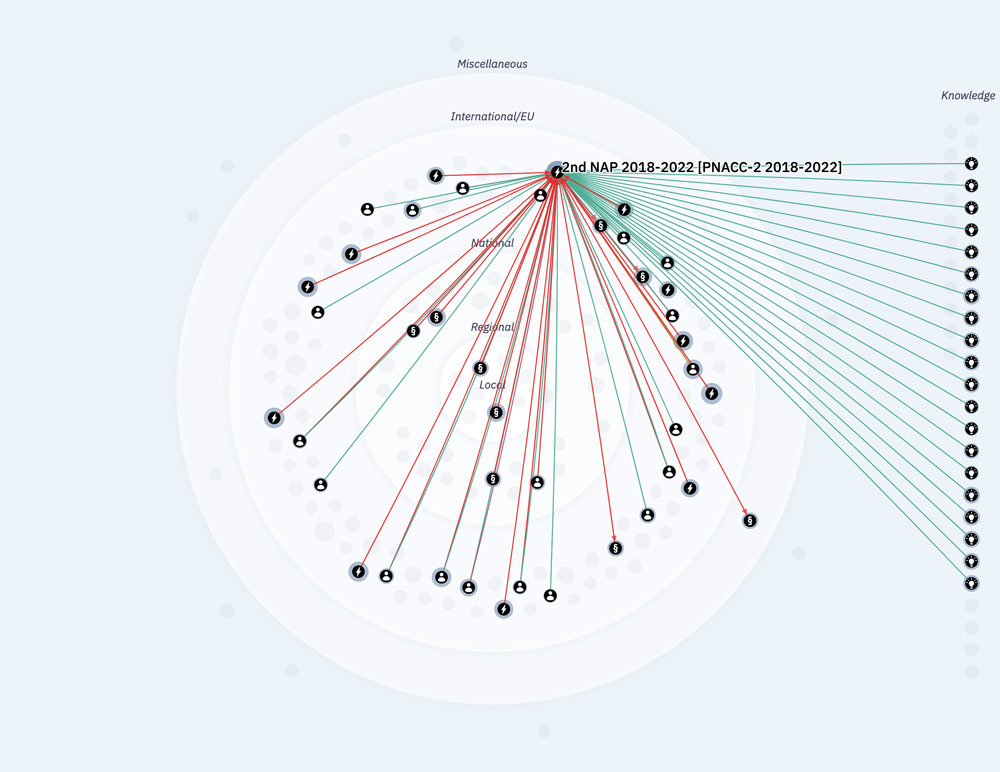
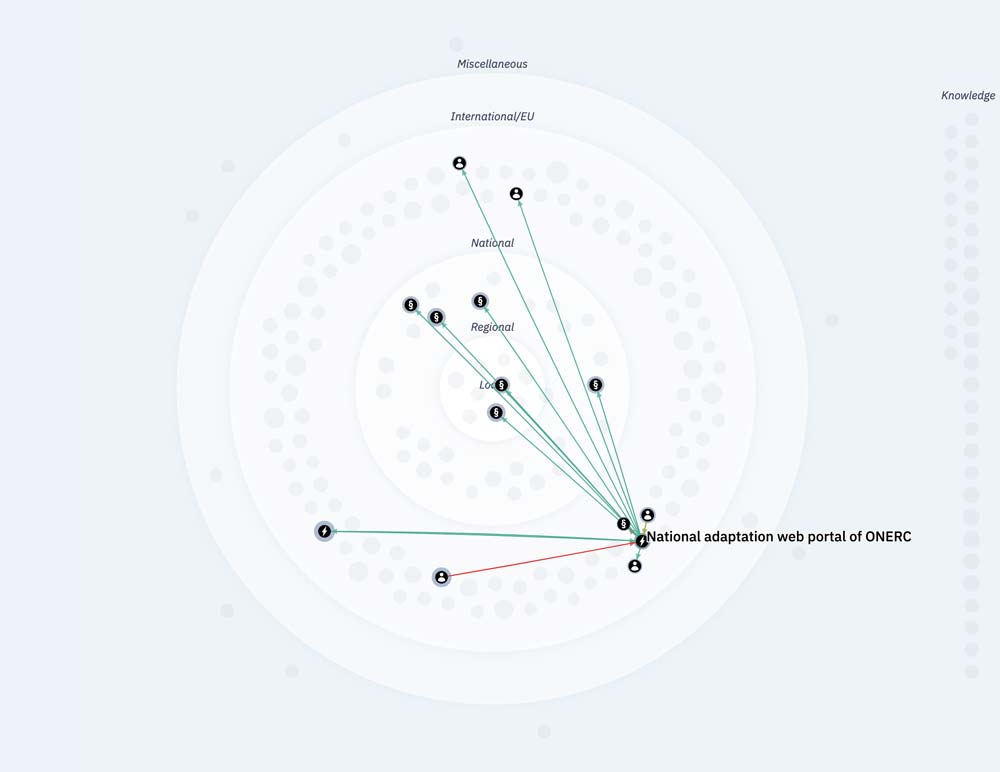
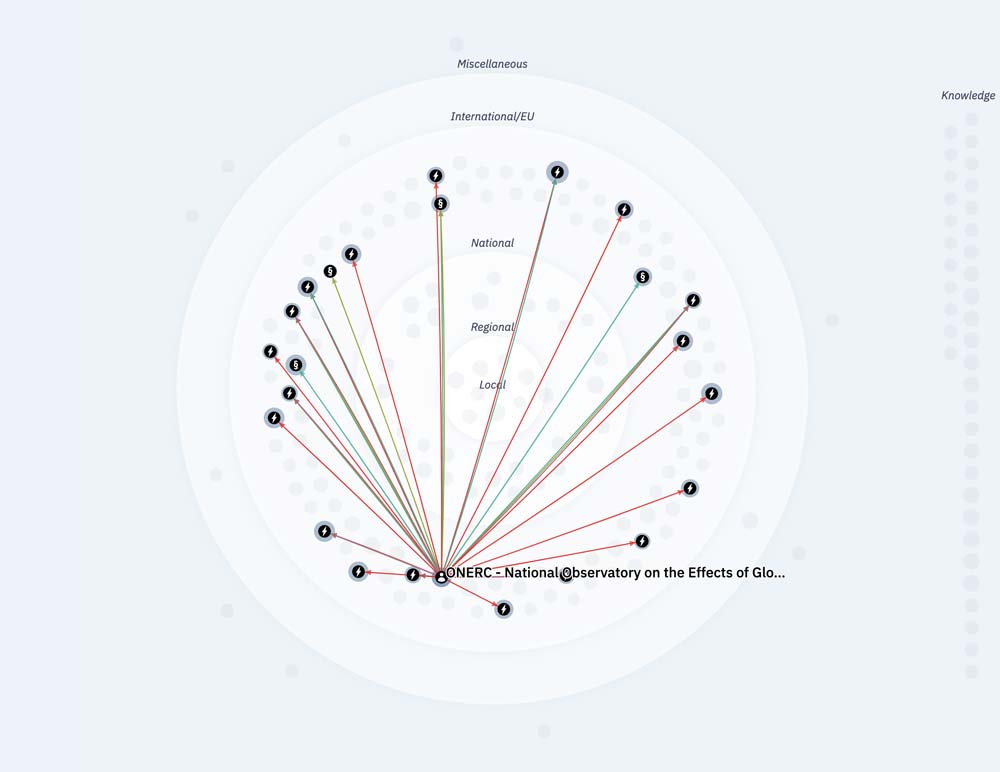
France has a long-standing track record in adaptation policy-making and a diversified related governance landscape. A National Adaptation Strategy is in place since 2006, and at the end of 2018 already the 2nd French National Adaptation Plan has been adopted. Taking a country-wide perspective, the present visualization covers the most significant adaptation policy documents on national level, the portfolio of statutory adaptation-related planning instruments deployed on subnational (regional to inter-communal) levels (incl. the Regional Plan for Territorial Planning, Sustainable Development and Territorial Equality – SRADDET ), the major knowledge resources informing policy development and supporting country-wide implementation of measures (incl. the national adaptation web portal of ONERC ) as well as the related actors with main roles in adaptation governance processes. An accessory thematic focus is applied to the mainstreaming of adaptation into the natural hazard and risk management sector. The measures of the 1st and 2nd French NAP have generally been mapped on the aggregated level of action fields, with a higher level of detail for measures addressing natural hazard issues. In order to capture concrete multilevel linkages, the mapping has an additional regional focus on adaptation governance in the French Alpine territories. The visualization of French national adaptation governance does not intend to give a complete picture, but it gives a general overview of the country-wide situation and highlights significant elements that are particularly relevant, interesting or innovative. The data for the mapping have been researched and compiled by the Environment Agency Austria. The French National Observatory on the Effects of Global Warming (ONERC) and French members of EUSALP Action Group 8 have provided important inputs, reviews and quality assurance.
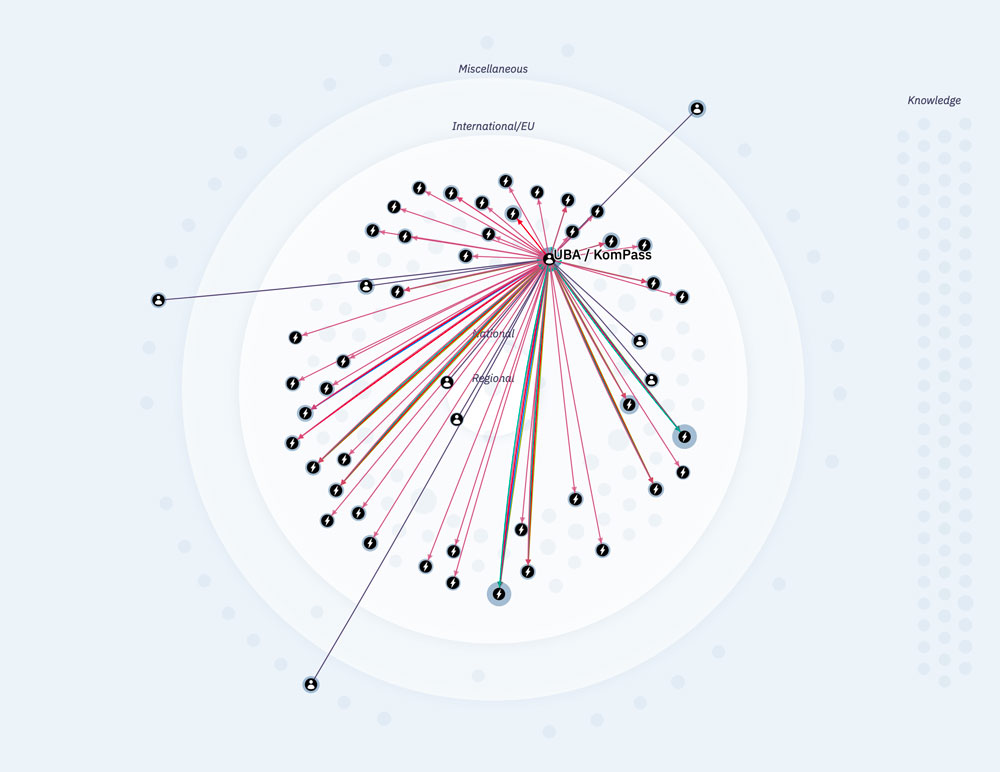
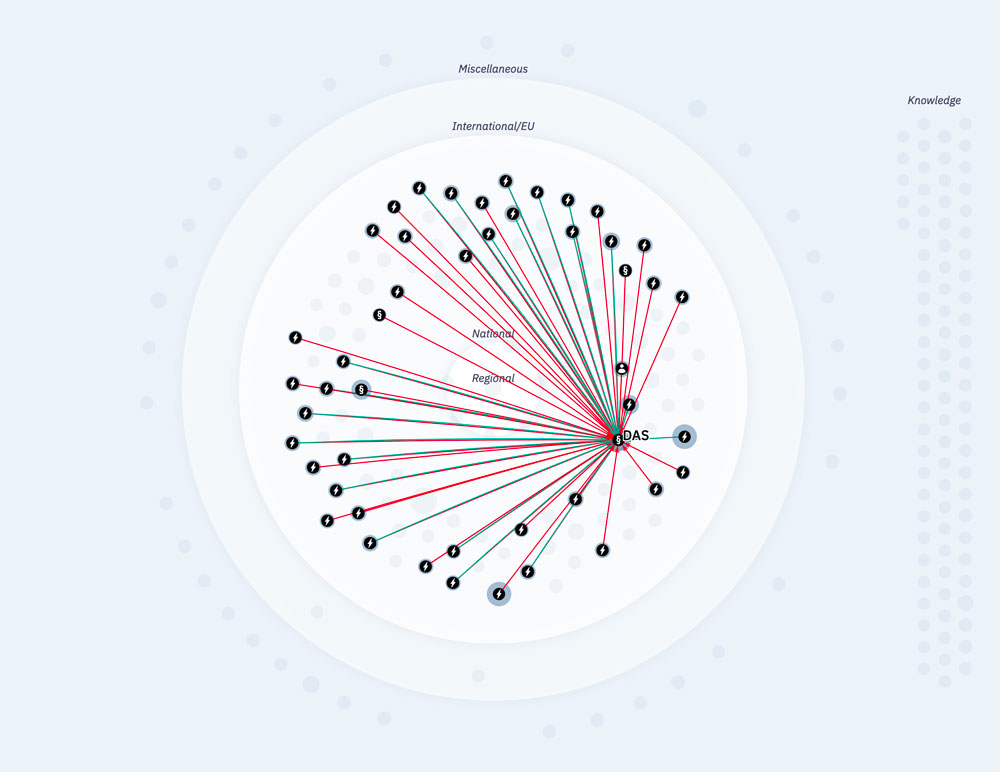
Germany
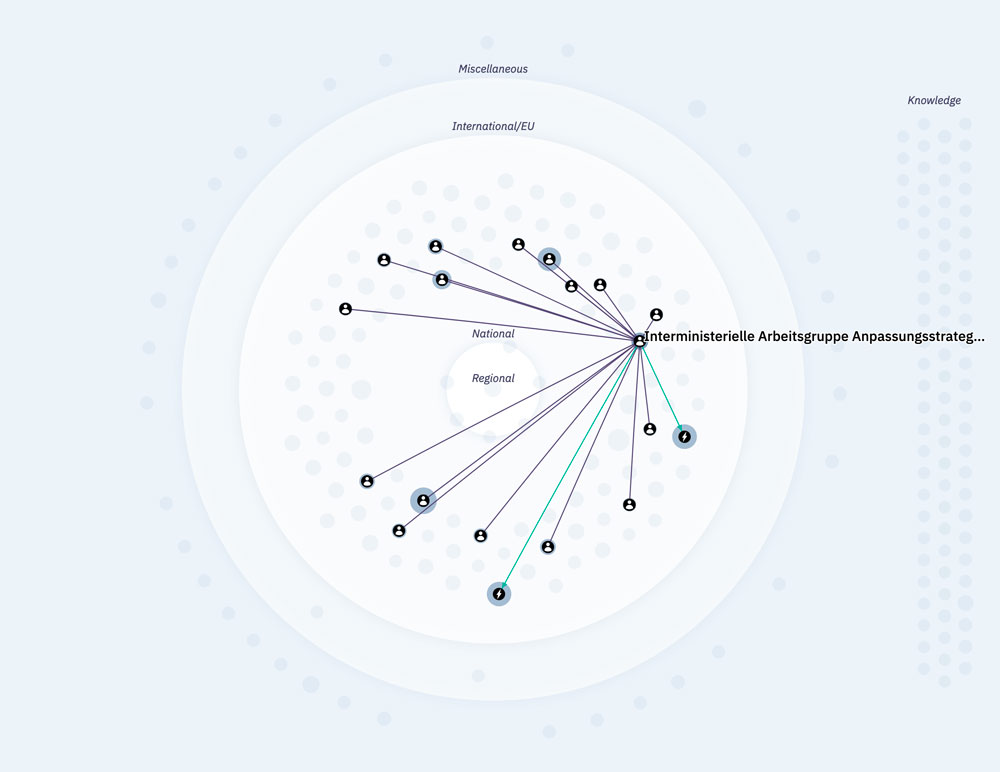
The adaptation governance landscape in Germany is complex. Besides the National Adaptation Strategy and Adapatation Action Plans I/II, all 16 federal states have their own adaptation strategy and governance processes in place. A growing number of municipalities has been developing adaptation strategies on the local level. The knowledge base for adaptation in Germany contains a vast number of information hubs, web portals, study results, project reports, climate service provisions, covering a wide range of action fields across all territorial and political levels. Therefore, this visualization focuses on governance elements, knowledge bases and services on the national level, including major actor networks and connections to institutions on state level. The information sources for the mapping are based, for the most part, on the work of the Section on Climate Impacts and Adaptation at the German Environment Agency (UBA KomPass), in particular the knowledge base provided by core KomPass products.
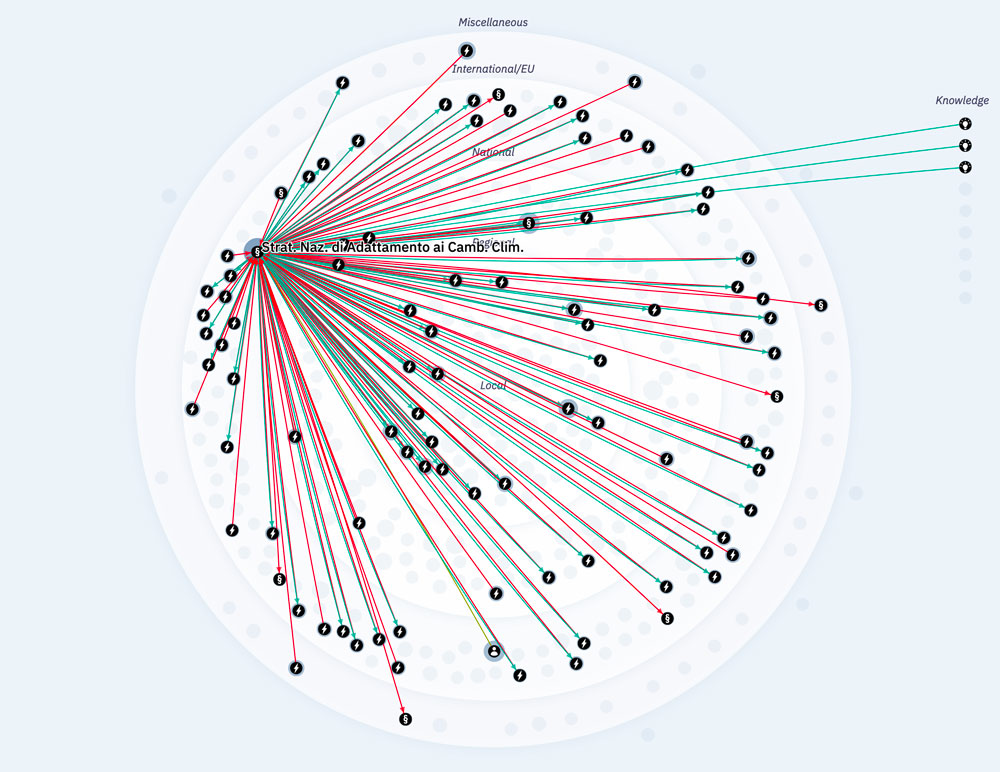
Italy
The landscape of climate adaptation governance in Italy is hereby presented through its most consolidated examples, namely the National Strategy for Adaptation to Climate Change (2015) and the overall action for adaptation of Lombardy Region: the Regional Adaptation Strategy (2014) and Regional Action Plan (2016). Adaptation to climate change is a process still at an early stage of development in Italy, yet it can count on a wide range of actors, policies and initiatives at every level, both institutional and from the civil society and the business community. The three chosen examples are able to present, respectively at the national and regional level, the network of elements active and interacting in different contexts in the field of adaptation in Italy, and represent the established institutional patterns aimed at structuring and harmonizing the adaptation effort of several local and sector-specific factors.
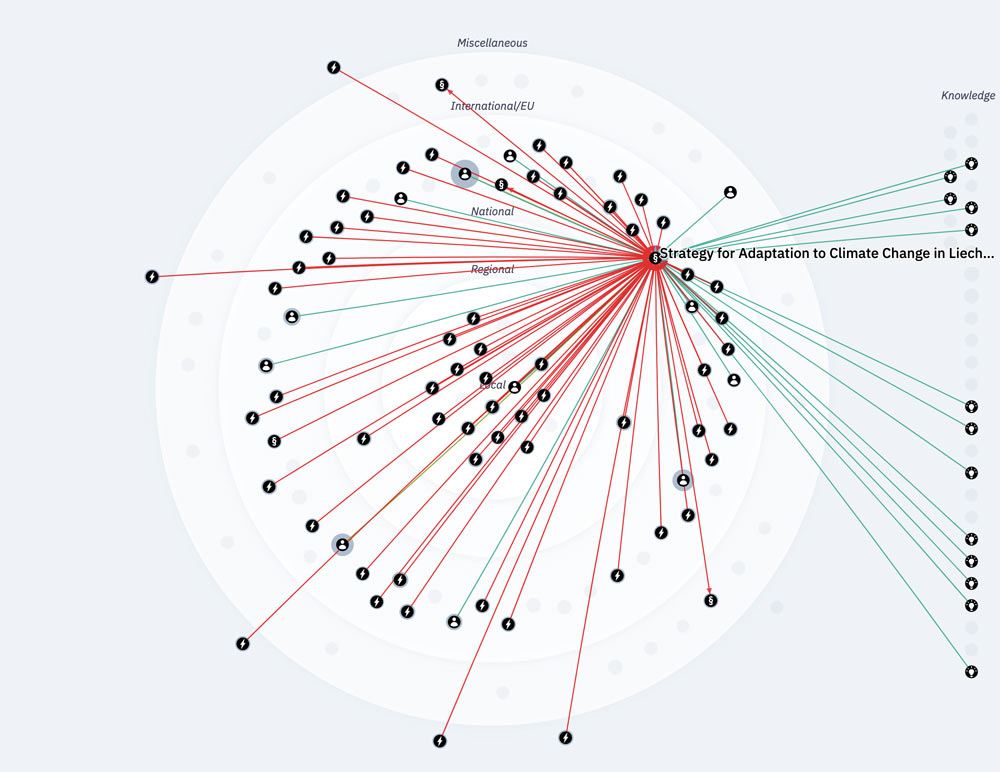
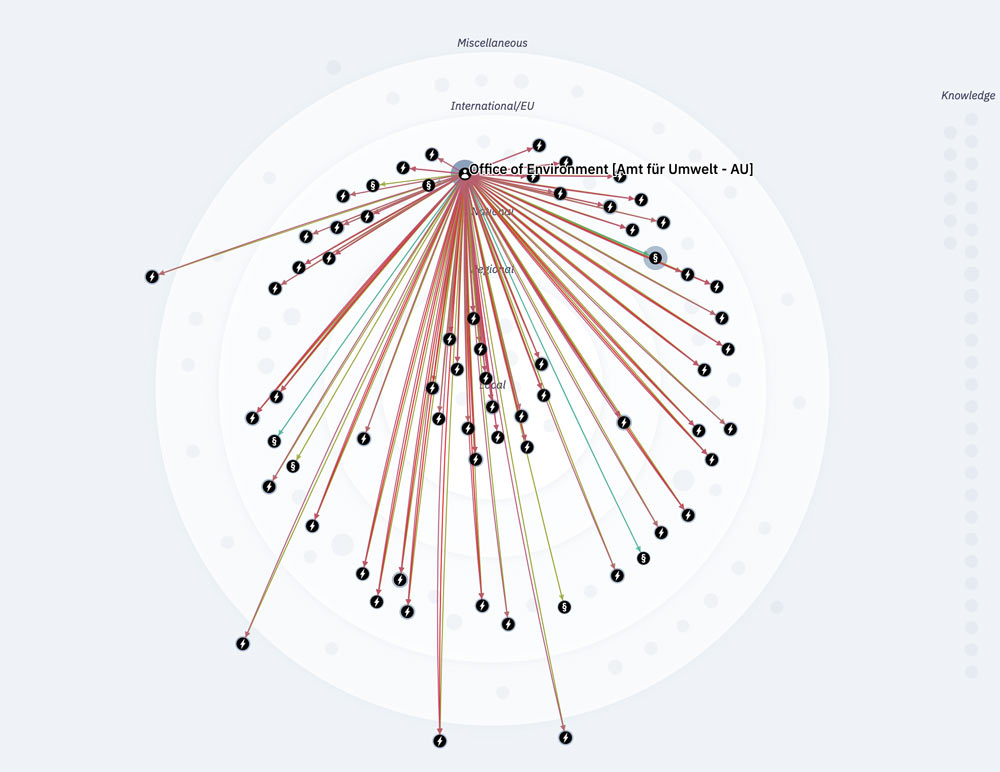
Liechtenstein
The centrepiece of national adaptation policy making in the Principality of Liechtenstein is the National Adaptation Strategy, which was politically adopted in 2018. The visualization of national adaptation governance shows a complete mapping of the NAS with in total 60 measures within 9 sectoral action fields. Due to geographic closeness and good relations with neighbouring Switzerland, adaptation planning in Liechtenstein is able to rely heavily on the knowledge base available in Switzerland. Swiss items that play a role in domestic adaptation processes in Liechtenstein as well are allocated to the governance level ‘international’ in the visualization chart, while respective specifications have been added in the information texts shown in the navigation bar. The data for the mapping have been researched and compiled by the Environment Agency Austria. In its roles as observer to the GoApply project and member of EUSALP Action Group 8, the Office of Environment (AU) of the government of Liechtenstein has provided important inputs, reviews and quality assurance.
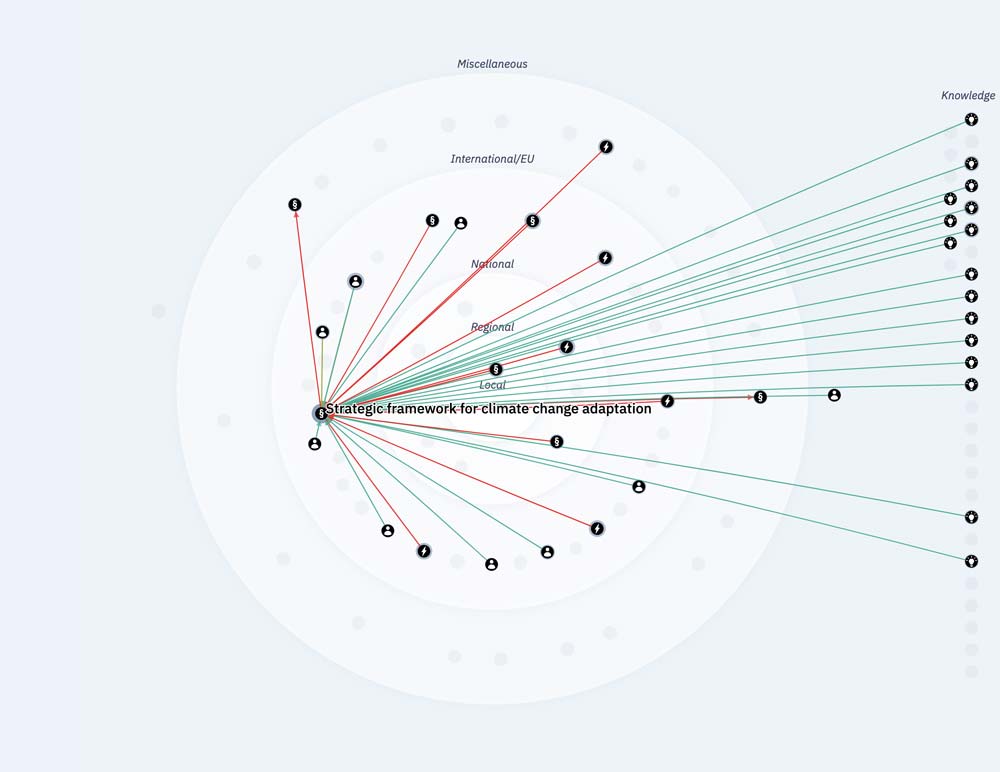
Slovenia
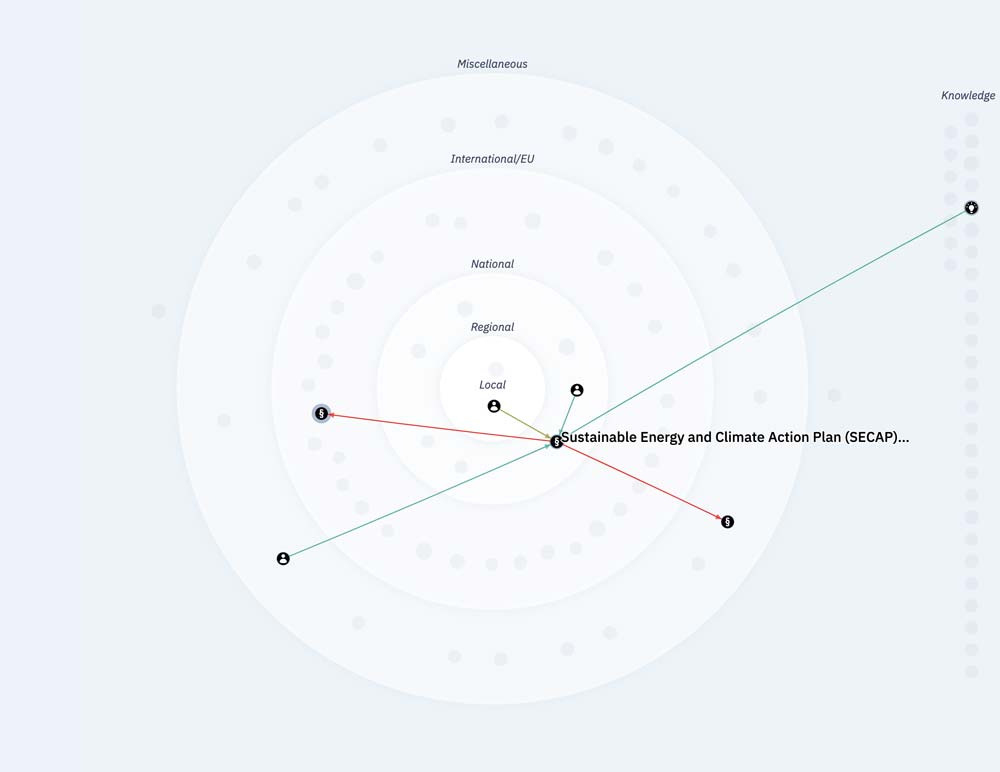
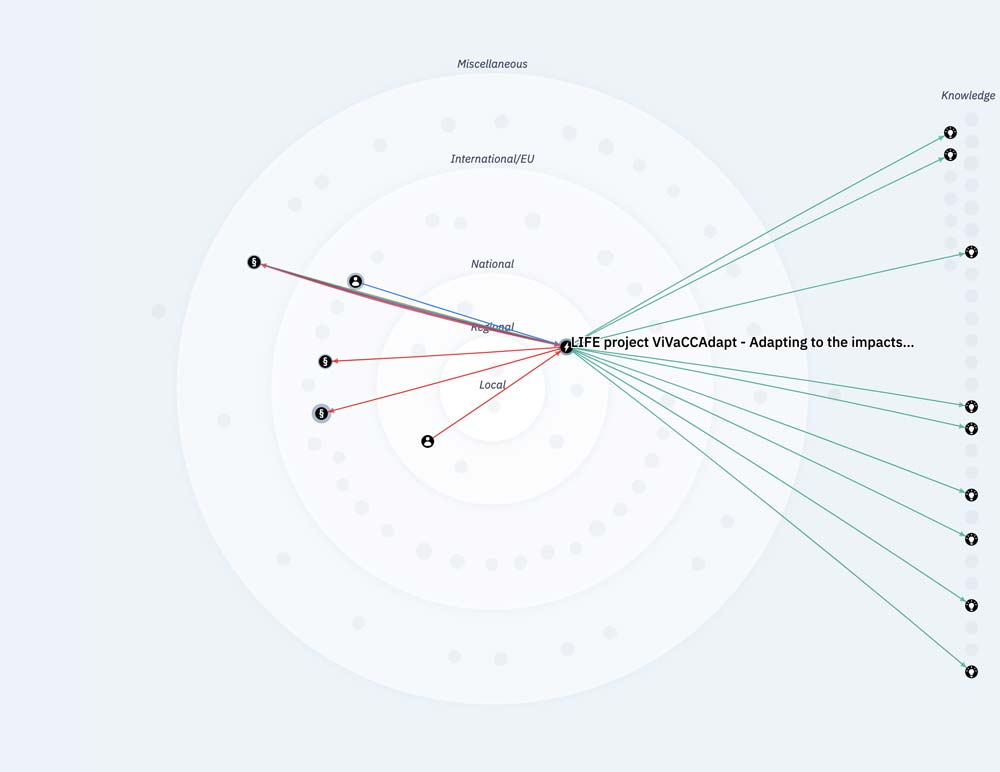
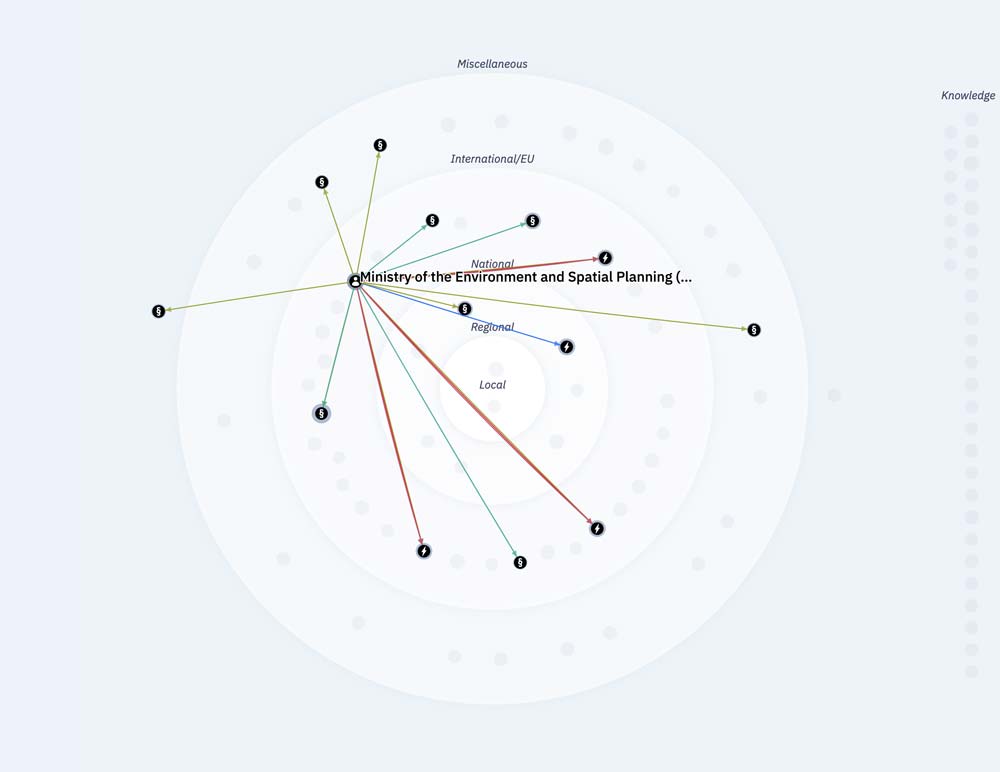
The visualization covers the national adaptation governance landscape in Slovenia, ranging from the national Strategic Framework for climate change adaptation to adaptation activities on the regional and local level, such as the Sustainable Energy and Climate Action Plan (SECAP) for Gorenjska region and the measures and knowledge delivered by the LIFE project ViVaCCAdapt - Adapting to the impacts of climate change in the Vipava Valley. The mapping includes governance items that are still planned, but have been notified for the near future, as well as provisions at EU and global levels that are explicitly referred to as significant policy inputs in Slovenian policy documents. A significant share of adaptation governance items (measures, knowledge resources) in Slovenia is connected to EU funding programs, projects and transnational cooperation structures (such as macro-regional strategies and transnational cooperation programs). The data for the mapping have been researched and compiled by the Environment Agency Austria. The Ministry of Environment and Spatial Planning of the Republic of Slovenia and Slovenian members of EUSALP Action Group 8 have provided important inputs, reviews and quality assurance.
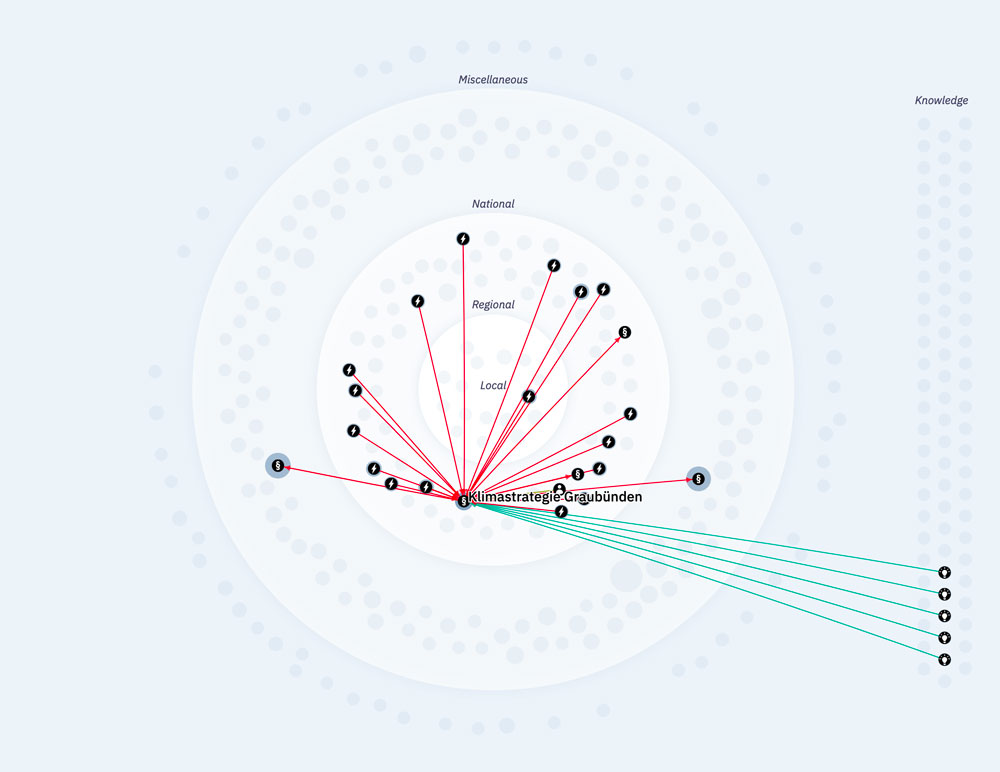
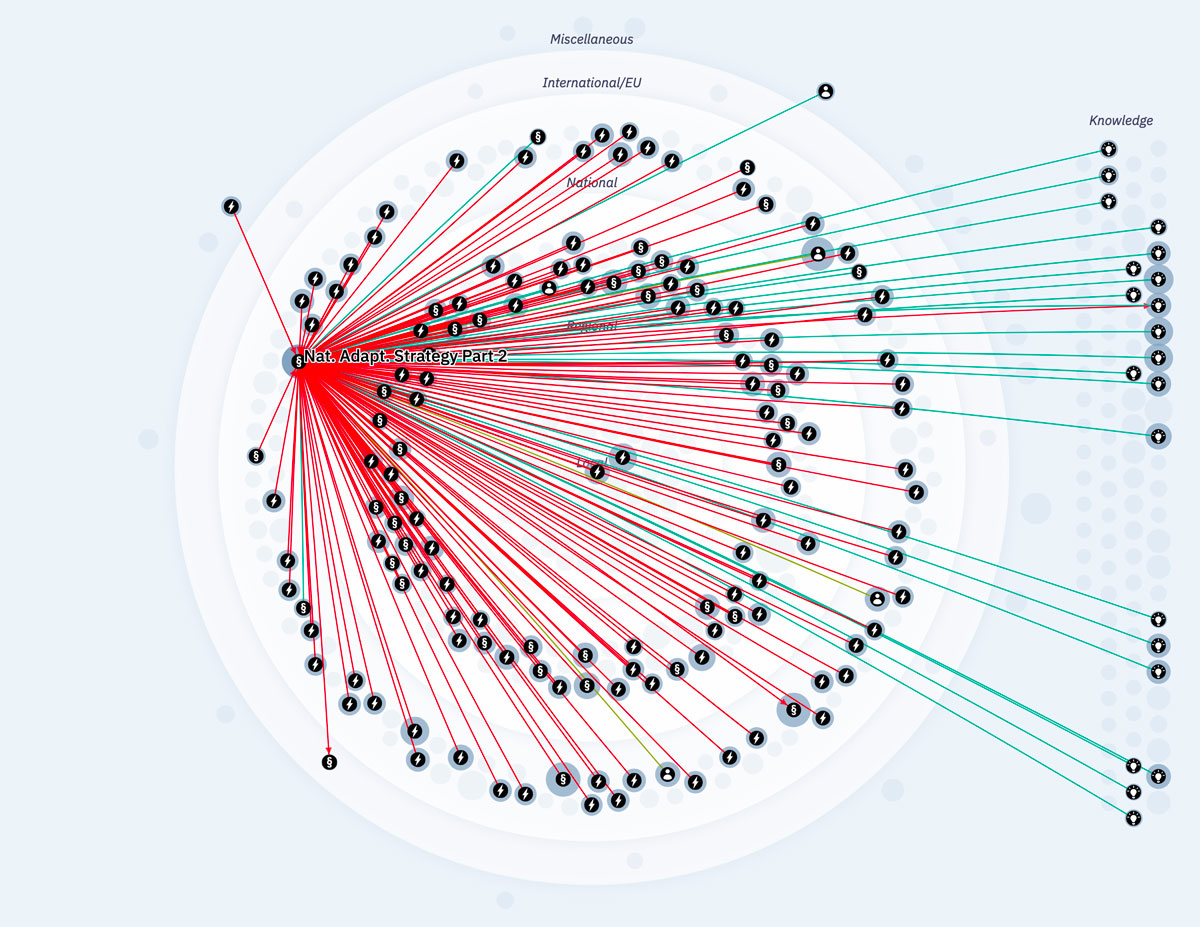
Switzerland
To start you out, we have chosen some interesting selections that are well suited to begin exploring the map. They show the details on the Swiss National Adaptation Strategy Part 1 and Part 2, the national Pilot Program Adaptation to Climate Change, the central role of the FOEN (Federal Office for the Environment) and the Climate Strategy of the canton Grisons.