
formerly RU Colloquium 
Introduction 
The research unit (RU) “Forest Resources and Management” holds a colloquium four times a year. Besides an update on organisational news, this bilingual event allows the exchange of cutting edge forest research, useful skills and advantageous techniques used for excellent science.
Research notes 
Abstract of presentations given at the FOREMA Quarterly Colloquia
4.12.2025 
Julia Schwarz: Potential of thinning to increase drought tolerance of forests 
Thinning can enhance the drought tolerance of existing forest stands by reducing competition for water, light and nutrients and by improving tree-level water extraction capacity. Evidence shows that thinning mitigates drought-induced growth decline and mortality during moderate droughts, although its effects diminish under extreme drought when soil water is fully depleted. Overall, repeated moderate thinnings appear most effective in maintaining forest vitality under increasing drought stress.
Barbara Allgaier Leuch: Die Jungwaldaufnahme im LFI ab LFI6 

Das Landesforstinventar (LFI) wird die Jungwaldaufnahme, d.h. die Erhebung und Beurteilung der Bäume und Sträucher von 10 cm Länge bis 11.9 cm Brusthöhendurchmesser (BHD) ab seiner sechsten Messkampagne (LFI6; 2027–2035) ausbauen. Und zwar wird es zusätzlich zu den Erhebungen auf dem Jungwaldsubplot die nächste Jungwaldpflanze pro Art und Jungwaldklasse ab Jungwaldklasse 2 (d.h. ab 40 cm Länge) auf dem 2-Aren-Kreis erfassen und auf Schäden (Verbiss, Fegen, Schälen, Krankheiten, Gipfeldürre, Holzernteschäden) beurteilen sowie bei den nächsten Pflanzen der Jungwaldklasse 2 (40–129 cm Länge) Trieblängen vermessen. Mit den zusätzlichen Erhebungen wird die Aussagekraft des LFI zum Jungwald verbessert, dies bezüglich 1) der selteneren Hauptbaumarten (z.B. Eiche), 2) der Erkennung von Veränderungen und 3) dem Pflanzenwachstum mit/ohne Verbiss. Der Ausbau ist das Ergebnis eines Projektes, das von Barbara Allgaier Leuch, Meinrad Abegg, Christoph Düggelin, Andrea D. Kupferschmid und Peter Stoll in den Jahren 2024 und 2025 durchgeführt wurde und nebst Datenanalysen auch eine Zeit- und Machbarkeitsstudie im Feld umfasste.
Sandro Bischof: Modelling forest canopy openness on the Euler Cluster (HPC) 

This work presents a large-scale modelling effort to quantify forest canopy openness across Switzerland using the CanRad canopy radiation model on the Euler high-performance computing cluster. The approach integrates diverse national geospatial datasets, including vegetation height models, forest inventory data, terrain models and forest-mixing layers, to generate high-resolution estimates of canopy openness, light transmissivity and hemispherical imagery. Processing demands are substantial: each square kilometre requires 23–29 hours of computation and large input volumes, resulting in approximately 106 GB of nationwide canopy-openness output. The results deliver detailed spatial products that support ecological analysis, forest monitoring and environmental decision-making.
23.6.2025 
Colin Bloom: Sentinel-2 and the Swiss Forest: Linking tree specific and landscape scales for improved monitoring 

Drought-driven forest decline across Central Europe demands effective and scalable monitoring tools. This presentation highlights our efforts to link tree-level physiological data with landscape-scale satellite observations to improve drought stress monitoring in the Swiss forest. The first component examines the relationship between Sentinel-2 vegetation indices (NDVI, NDWI, EVI, CIRE, and CCI) and continuous stem-level water deficit measurements made by the TreeNet Network between 2017 and 2023. Monthly aggregated time series for 102 Norway Spruce and European Beech reveal moderate to strong correlations (R² up to 0.62). Indices like EVI and NDWI may be helpful in detecting broad seasonal water stress trends. However, fine-scale detection of recoverable stress remains challenging. The second component examines the extent of early leaf discoloration in European Beech, a visible stress response that often precedes dieback. Using a combined dataset of field observations (including 1000 Beech and RapiDBeeCH data) and annually normalized Sentinel-2 indices, a model was trained to predict early discoloration from April to August (2017–2023) at 10 m resolution. Severe drought years such as 2018 and 2023 exhibited a dramatic increase in early discoloration, with hotspots emerging as early as late-June. Together, these studies demonstrate how global remote sensing can bridge ground-based and landscape monitoring, offering a powerful framework for assessing forest health under a changing climate.
Daniel Scherrer: Indikator zur Bewertung der Naturnähe der Baumartenzusammensetzung 
In Zusammenarbeit mit dem Bundesamt für Umwelt (BAFU) und unter Einbezug verschiedener Akteure aus Forstpolitik und -wirtschaft wurde ein neuer Indikator zur Bewertung der Naturnähe der Baumartenzusammensetzung entwickelt. Ziel ist es, diesen Indikator als Bestandteil in die Integrale Wald- und Holzstrategie 2050 (IWHS) zu integrieren.
Der Indikator ermöglicht eine differenzierte Einschätzung der Naturnähe auf Bestandesebene, indem er die aktuelle Baumartenzusammensetzung mit jener des potenziellen Naturwaldes vergleicht – sowohl unter heutigen als auch unter künftigen Umweltbedingungen. Besonderheiten wie Jungwüchse oder Bestände in der Pionierphase werden gesondert berücksichtigt. Bei als naturfern eingestuften Beständen erfolgt zusätzlich eine Kategorisierung nach den Hauptursachen der Abweichung.
Dank seiner konzeptionellen Ausgestaltung lässt sich mit dem Indikator die Entwicklung der Naturnähe über Zeitreihen hinweg analysieren – sowohl rückblickend auf vergangene Erhebungen als auch vorausblickend auf künftige Szenarien im Rahmen des Schweizerischen Landesforstinventars.
Yuman Sun, Ross Shackleton, Marco Ferretti: Tree vitality, multiple stressors and the European forest carbon sink 

Changes in crown density (popularly termed “defoliation”) can reveal important modifications in tree health and vitality and is a common, though unspecific, forest health indicator adopted in Europe and elsewhere. Here, we leveraged different data and methods to study the development of defoliation on living trees, its main drivers and its expected impact on growth and carbon (C) sequestration.
Firstly, we used data collected by ICP Forests (Level I) to analyze the spatial and temporal patterns of defoliation of living trees across 19 European countries from 1990-2022. Secondly, we assessed the effects of (i) biotic and abiotic agents, (ii) air pollution (data from EMEP), and (iii) climate (data from ERA 5 Land and SPEI) to identify the main correlates of defoliation. Thirdly, we synthesized published data through a systematic literature review, to develop generalized relationships between defoliation and growth and to estimate the potential effect of changes in defoliation on the growth of the tree population examined. Finally, we investigated the relationship between defoliation and C sequestration over the investigated spatial and temporal domain.
Our results show an accelerating, though regionally variable, increase in tree defoliation over the past ten years. Such an increase is due to the concurring action of multiple biotic and abiotic stressors, with climate-related drivers having a triggering effect. Defoliation had a significant impact on tree growth resulting in a ~ 4% decrease in recent growth at the European level as compared to the 1990-1999 period. Further, increasing defoliation parallelled the observed reduction in European C sequestration.
We conclude that, besides tree mortality, a significant decline in tree vitality is going on, with potentially pervasive effect on the European forest C sink. Together with other findings, our results suggest that a reconsideration of the role of European forests for climate change mitigation is urgent.
6.3.2025 
Claudia Guidi: Improving litterfall estimation in European forests through harmonized forest monitoring data 

Litterfall is a major pathway of carbon (C) and nutrient input to the soil. Accurate litterfall estimation is required by soil C cycling models to assess forest soil C balance for greenhouse gas (GHG) reporting. However, field observations of litter-derived C inputs are particularly scarce at large scales. To harmonize and improve accuracy in the estimation of foliar and fine-woody inputs in European forests, we aim to evaluate (1) main litterfall drivers, (2) existing litterfall models, and (3) develop new regression models based on properties available from forest inventories. We used a dataset including litterfall and stand properties (2002-2020) at 297 forest sites of the European-wide monitoring network ICP Forests covering a large climatic gradient, different forest types, and biogeographical regions.
Stand basal area (BA) is a key driver of foliar and fine-woody litterfall rates, with climate playing a more relevant role in coniferous compared to broadleaves forests. To estimate foliar and fine-woody litterfall in European forests, we fitted new models including key drivers of litterfall production (BA, temperature, and precipitation). The litterfall models can be applied in countries where country-specific methods based on measured litterfall data are not available, thus contributing to the implementation of higher tier methods for soil C reporting following LULUCF, and further tested in countries where such methods already exist.
Esther Thürig: Joint Initiative SCENE Net-Zero – contribution of the “biomass carbon cycle” 

The SCENE Joint Initiative has established a Center of Excellence that covers a wide range of research areas related to net-zero emissions and provides a platform for cross-institute collaboration in the ETH Domain. More than 100 researchers in 30 laboratories from all four research institutes of the ETH Domain (PSI, Empa, WSL, Eawag) and the two technical universities ETHZ and EPFL are involved. The project is led by PSI and runs from 1.1.2023 - 30.06.2026 with a total budget of approx. 17M CHF. In order to support the achievement of the goal of net-zero emissions by 2050, described in the federal government's climate and energy strategies, SCENE performs research in six Net-Zero Priority Action Areas, covering the avoidance, removal, monitoring and analysis of greenhouse gas emissions.
In the action area “Biomass Carbon Cycle” we demonstrate optimization pathways of forest and landscape management, the utilization of woody biomass, and substitution effects to mitigate climate change. We build a modeling framework to analyze how the contributions of forests, woody biomass and timber products to reduce CO2 emissions in Switzerland could be enhanced by climate-adapted forest management, increased production, use and recycling of timber products and the end use of biomass for energy production.
Roman Flury and Rebecca Buchholz: Why Should You Use GitLab? 

Reproducibility, transparency, and collaboration are fundamental to modern scientific research. GitLab provides a powerful version control and project management platform that enables researchers to efficiently track changes, collaborate across teams, and ensure the long-term integrity of their work. GitLab supports structured and reproducible research workflows by integrating version control, issue tracking, and continuous integration.
This presentation will give a glimpse of the benefits of using GitLab in scientific projects, including versioning and automated pipelines. We will also discuss its integration with tools like RStudio, making it an essential resource for computational and data-driven research. By adopting GitLab, scientists can enhance their work's transparency, efficiency, and reproducibility, fostering better collaboration and innovation in research.
Janine Schweizer, Sunni K.P. Kushwaha: Digiforest project: Digital analytics and robotics for sustainable forestry 

The increasing complexity in decision-making forest managers have to tackle needs to be addressed by equipping them with the best possible spatial decision support system. However, the availability of high-quality input data is the key for the efficiency and accuracy of any model and can significantly contribute to enhancing the quality of decisions. In the framework of the EU project DIGIFOREST, an innovative novel approach to transform to large scale precision forestry management is proposed. The project is centred on the collection of detailed and diverse forest data at the tree level using different types of mobile robots and the turn of forest scans into actionable data. Moreover, the aim is to take it a step further by fostering digitalization across the entire forestry value chain, including the design of logging operations through a desktop application and the execution of autonomous selective cutting. The core question addressed is how digital analytics and robotics can be used and made applicable to enhance forest management and the forestry value chain. The presentation will give an overview about current project activities.
For further information visit: https://digiforest.eu/
3.12.2024 
Mirko Lukovic: Applications of machine learning to tree growth analysis and wood grading 

We use data produced by industrial wood grading machines to train a machine learning model to predict strength-related properties of wood lamellae from colour images of their surfaces. The focus is on samples of Norway spruce (Picea abies) wood, which display visible fibre pattern formations on their surfaces. We start with a pre-trained machine learning model based on the residual network ResNet50, which we trained with over 15 000 high-definition images labelled with the indicating properties measured by the grading machine. Considering the ever-increasing demand for construction-grade wood, we argue that computer vision should be considered a viable option for the automatic sorting and grading of wood lamellae in the future.
We also use machine learning to reconstruct redial stem size changes of trees. It is very difficult to model and predict the growth of trees because they are biological systems that respond not only to actual conditions but also to the experience of the preceding years. This memory effect, or legacy effect, makes it, besides other known and unknown factors, difficult to develop a reasonable model for tree growth on the short- as well as long-term scales.
We therefore focus on the analysis of near real-time high-resolution dendrometer data from various tree species across Switzerland provided by the TreeNet project.
We train different neural networks to use the dendrometer signals and the available metadata as input to infer and forecast stem growth properties.
Aline Bornand: Using deep learning to predict the shape of tree crowns from incomplete point clouds 

In terrestrial and mobile laser scanning (TLS/MLS) acquisitions, treetops are often missing or incomplete due to occlusion effects or distance to the scanner. We present an approach based on deep learning point cloud completion, which aims to reconstruct the outer hull of single trees from incomplete TLS or MLS data. Validation with complete data and field measurements shows that the tree height can be reconstructed in many cases.
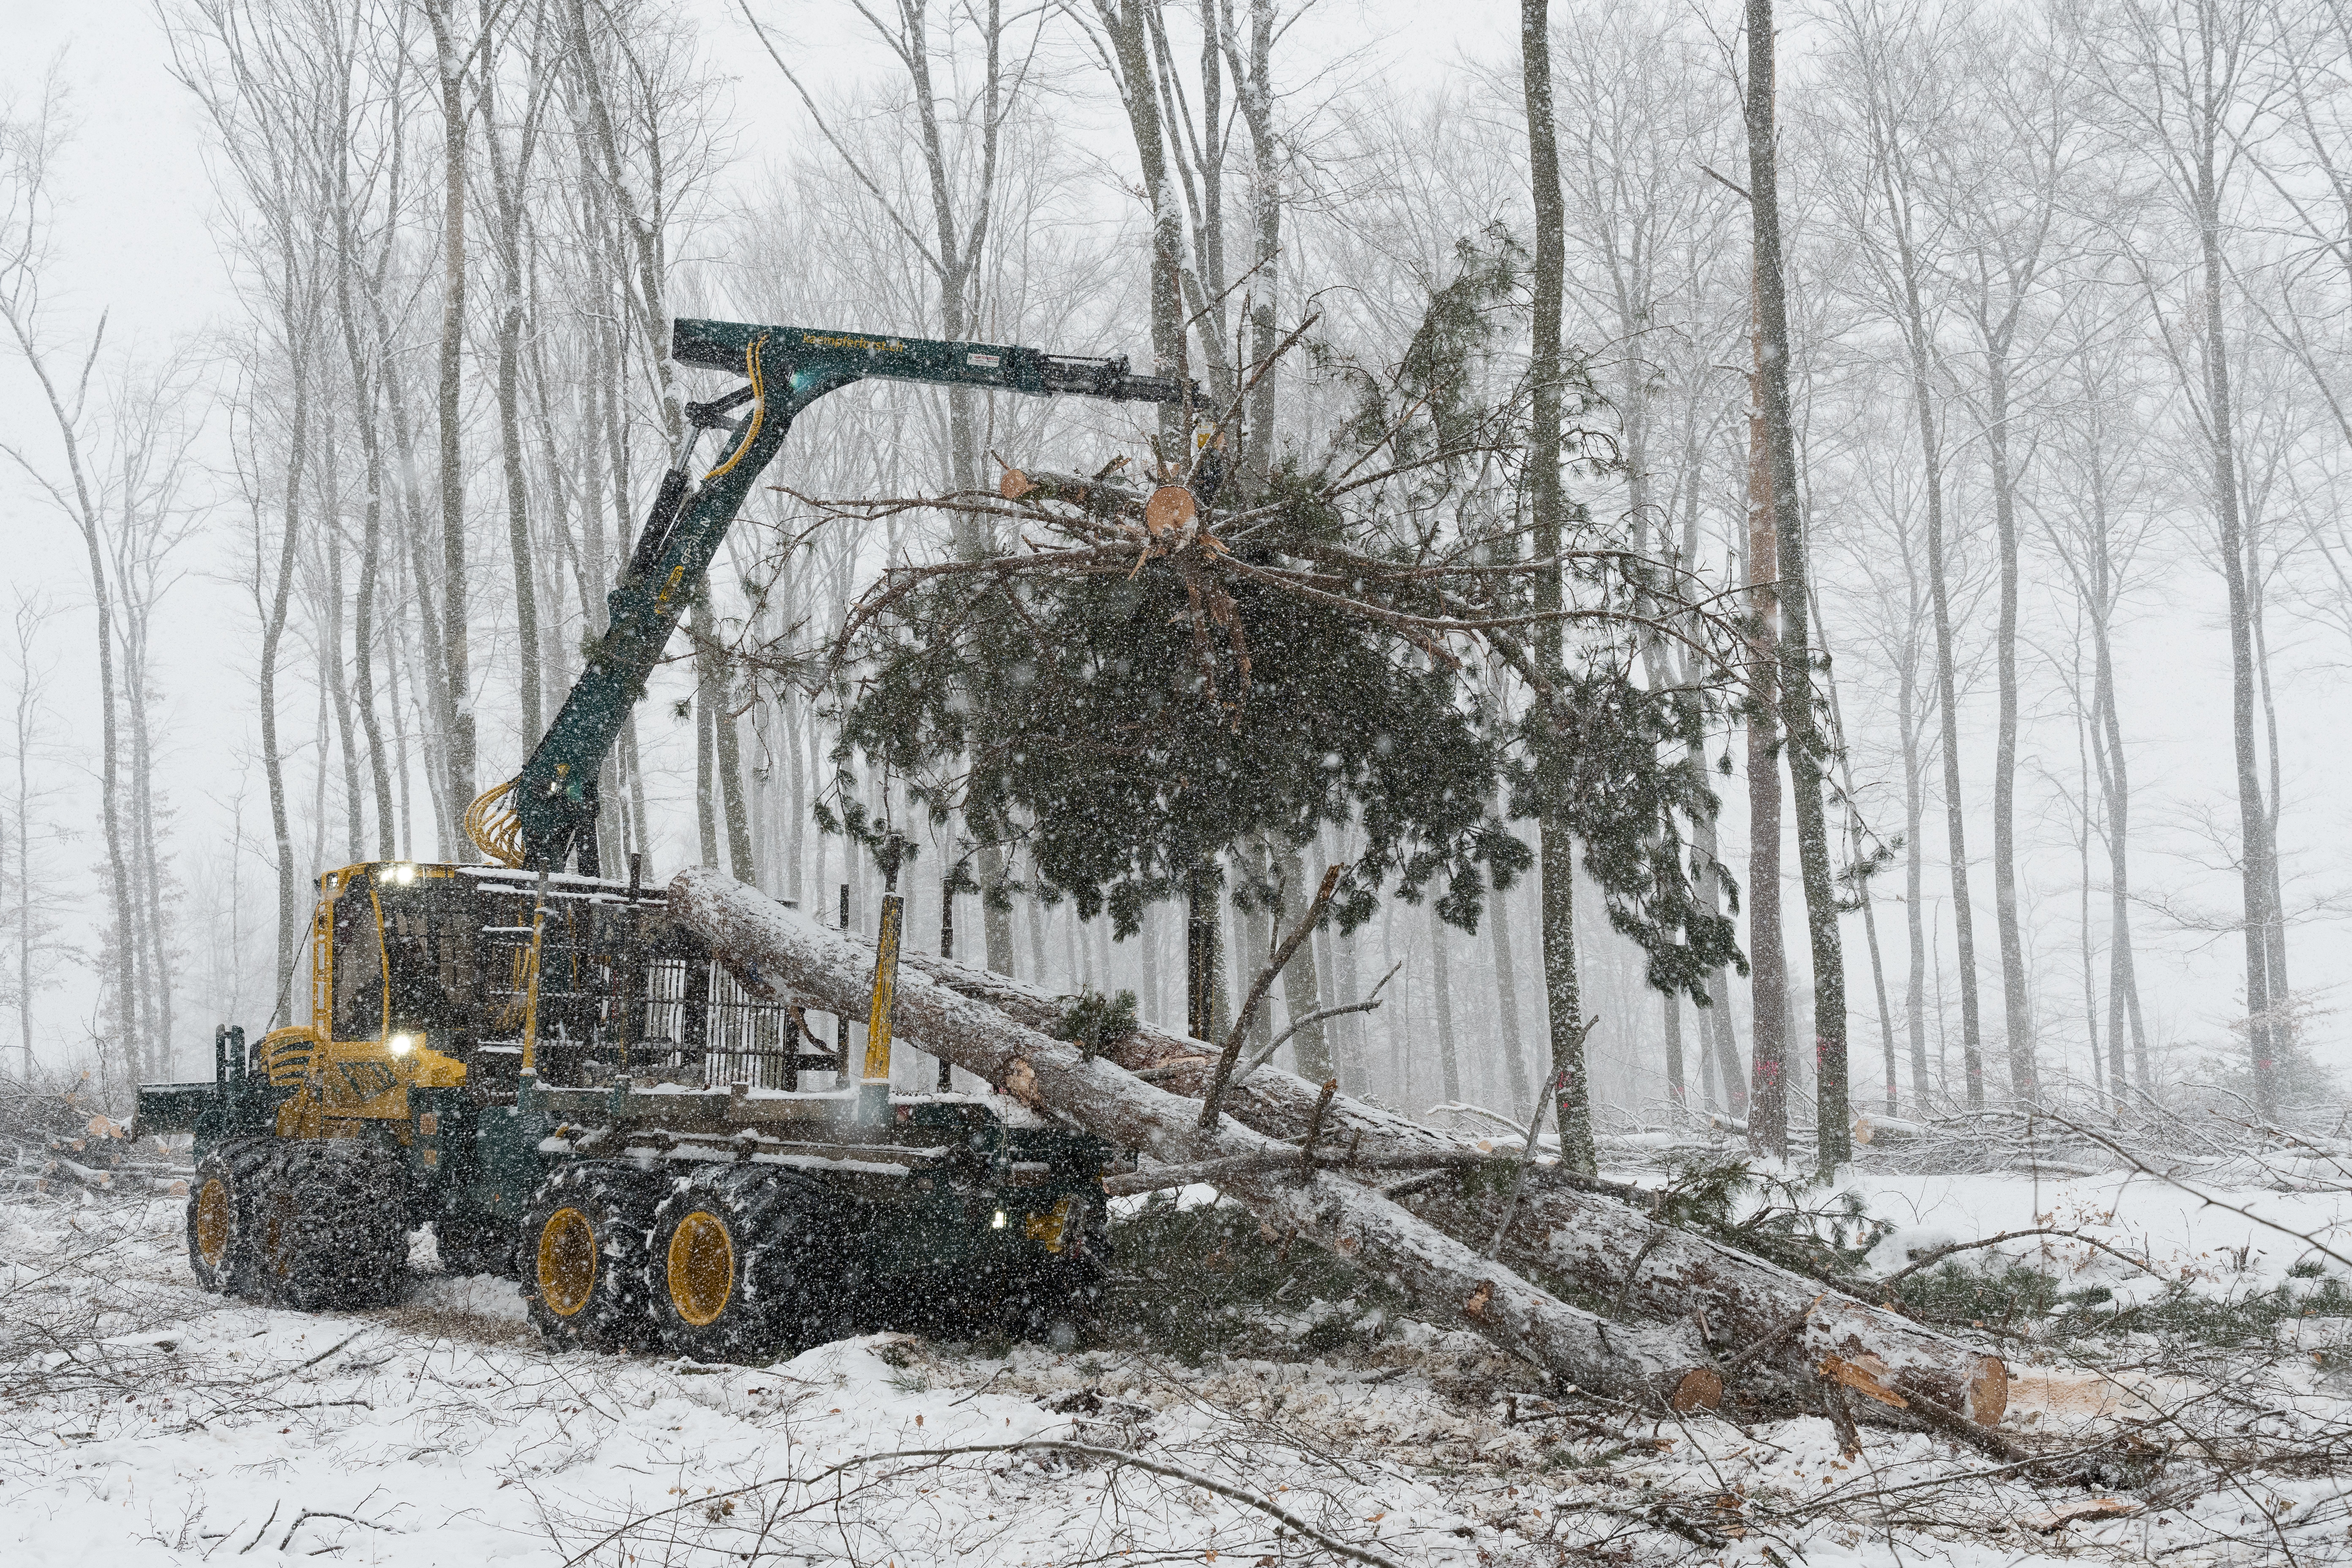
Meinrad Abegg: integration of wood harvesting and recreation - the raker tooth saw 

The raker tooth saw started to be commonly used in Switzerland in the 1930s. However it mostly disappeared from the forest during the 1950s with the broader use of chainsaws. In this (fun) talk the functionality, the most important aspects of maintenance and the efficient use is presented.
18.9.2024 
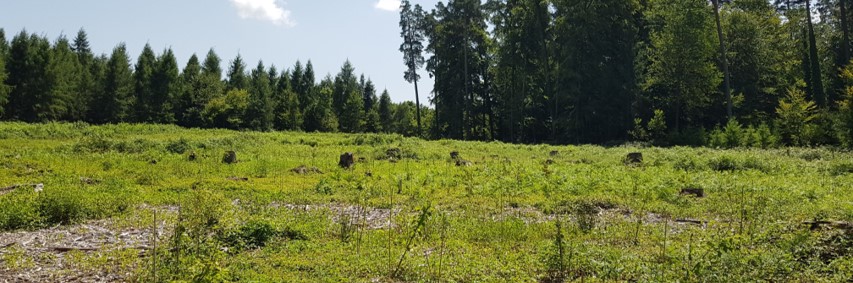
Golo Stadelmann: Effects of regeneration and adaptive planting on Swiss forests 

Climate change affects forests, and the effects are expected to increase in the coming decades. Therefore, adaptive management strategies are essential to mitigate these effects. We used MASSIMO, an empirical individual-tree management scenario simulation model, to investigate the ability of Swiss forests to adapt their tree species compositions to changing climatic conditions. Specifically, we implemented an adaptive planting module that enables, in addition to natural regeneration, the planting of tree species adapted to the expected future climate conditions. The planting module is based on observed tree species mixtures from the Swiss NFI and on expert recommendations for current and potential well-adapted future plant communities. Thereby, future plant communities have been simulated based on current plant communities, soil information and climate scenarios. These plant communities depict the idealized tree species composition (including recruitment) in natural forests in balance with the dominant current or future environmental conditions. For planting, we considered both native and non-native species (including e.g., Pseudotsuga menziesii, Cedrus atlantica and Quercus cerris). Adaptive forest development simulations with MASSIMO, reflecting a strong shortening in rotation periods indicated that changes in species composition were considerably slower than required to match future climate conditions. This was observed with both natural regeneration and adaptive planting. To effectively address future climate challenges while ensuring sustainable timber production, protective function and other ecosystem services, Swiss forests may require regulating species mixtures not only in regeneration but also in timber stages.
Esther Thürig: Climate effects of forests and wood industry– Tightrope walk between chances and pitfalls 

The contribution of forests and wood products to mitigate global CO2 emissions is highly debated in science and policy. The climate services of forests are influenced by forest management and timber use. Quantitative studies on carbon sinks in the forest and timber sector show a wide range of forest management and timber use scenarios. They range from reduced management with increasing carbons stocks in forests, to increased harvesting with the aim of substituting fossil resources.
In 2010, a Swiss study concluded that in the long term, scenarios with slightly increased forest management, subsequent production of long-living products with possible end-use for energy achieved the highest climate service. In our recent study, results for Switzerland are ambiguous. For this study, we combined a model framework of Massimo/Yasso07 for Switzerland and Globiom/G4M to account for the European effects. We explored the difference between national and European perspectives and further studied the effects of discounting displacement factors. If future production of steel and concrete will become less CO2-intensive due to decarbonization of industrial processes, displacements factors of today will most probably be reduced in future.
Preliminary results show that discounting displacement factors can shift the scenario results completely. Moreover, only considering the national perspective produced rather different scenario results than also accounting for the European forest.
We conclude that both the handling of displacement factors in the light of future climate policy and the national versus international trade balances and system boundaries are crucial to simulate global climate integer scenarios for the forest and timber sector. Main gaps we see in considering different approaches such as the production or the consumption approach. However, compliance with international negotiations and national incentives often promote national production approaches, only. Further, increasing risks of drought, biotic diseases and windthrow should be better reflected in the models.
In an ongoing project we therefore develop a national dynamic carbon-accounting framework for woody biomass, timber products and their substitution effects for fossil material and energy. In this study we plan to incorporate changing disturbance regimes in forests, new possibilities for long-living material use, material recycling, and different accounting approaches.
Christian Temperli: Future suitability of the tree species composition in Swiss forests 

Climate change affects tree growth which is why striking shifts in the tree species composition of the Swiss forest are expected in the long term. The TreeApp is a tool for forestry to identify tree species likely suitable under future climate. We compared the recommendations from the TreeApp with the species composition of trees (≥12 cm diameter at breast height [BHD]) and regeneration (<12 cm BHD) observed in the 4th National Forest Inventory (LFI4). We present a simple assessment scheme to classify the NFI sample plots into three levels of future suitability (degree of adaptation to climate at the end of this century). Across Switzerland, 57% of the plots were rated as suitable, 23% as partially suitable, and 17% as not suitable. Not suitable spruce forests accumulated in the cantons of Graubünden and Valais. In protective forests in the Prealps, the Alps and south of the Alps, regeneration was assessed as not suitable in 25% of the sample plots and no regeneration was observed on 22%. The proportion of sample plots with not suitable tree population increased with the proportion of spruce. In the Plateau and the Jura regions, regeneration was suitable for future conditions on a larger proportion of plots than the tree population. When seed trees were considered, the proportion of sample plots with suitable tree population was up to 16 percentage points higher than when only regeneration was considered. These results highlight the need to promote future climate-adapted regeneration in mountain forests, inform strategic forest management planning, and thus contribute to forest adaptation to climate change.
Roman Flury: Spatio-Temporal Analysis of Forest Inventories: Challenges and Approaches for Modelling Ingrowth Dynamics 

National Forest Inventories (NFIs) are crucial in monitoring forests and their ecosystem services in many countries. Such inventories have evolved over the years, adapting sampling strategies to address new threats and advancing monitoring devices. This study uses statistical spatio-temporal methods to analyze data from complete and ongoing forest inventory cycles in Switzerland, specifically focusing on ingrowth within forests. In the Swiss NFI, ingrowth is defined as trees that meet the caliper threshold of at least 12cm diameter at breast height (dbh) between two consecutive inventories. Our analysis includes the spatio-temporal modeling of the number, the tree species and the dbh of ingrowth trees based on roughly 5’500 plots that have been measured since 1983.
We use multivariate spatio-temporal modeling techniques based on the realization of a stochastic process. In this context, we examine the difficulties of applying these models to the Swiss NFI data, particularly the fundamental change in sampling periods after the third inventory cycle, when serial sampling changed to continuous sampling with 1/9 of the plots remeasured every year. In addition, the assumptions of these models, such as translation and rotation invariance, and their implications are discussed in more detail. Moreover, we emphasize computational burdens and bottlenecks resulting from the increasing size of NFI datasets. The findings shed light on the intricacies of forest ingrowth processes in space and time and offer valuable insights for sustainable forest management. Furthermore, with this study, we contribute to the broader field of analyzing NFI data since these models can be adapted, for example, to other demographic processes such as mortality or growth.
17.6.2024 
Frank Hagedorn: Soil carbon cycling in future forests 

Soils represent the largest C pool in terrestrial ecosystems and CO2 fluxes between soils and the atmosphere exceed fossil fuel emissions. However, their role in carbon sequestration is still highly uncertain due the complex nature of soil organic matter and the multitude of controlling factors. Here, I will give an overview about carbon storage in Swiss forest soils and discuss how soil carbon responds to ongoing changes in climate.
Sunni Kanta Prasad Kushwaha: Evaluating the efficiency of different TLS combinations in forest plots 

TLS is a Close-Range ground-based, static LiDAR system that calculates the 3D position of a target using the concept of time-of-flight principle. Multiple scans are acquired from different positions, and later, all the individual point clouds are merged to form a single complete point cloud dataset. TLS scanning is acquired from different positions in a forest plot in such a way that there is the least amount of region that is not captured from either of the TLS positions. Several TLS scans and optimum position are dependent on the size of the forest plot, tree densities, forest complex structure, and range of the instrument. Point cloud data is a set of unstructured data points in a 3D coordinate system in which points can represent the object's surface, and each point represents a single spatial measurement. In forests, it is always thought that maximum TLS scans are required to obtain more detailed information on the vegetation structure. However, this may not be efficient in all cases. As the number of scans increases, the redundancy in the dataset, overall data size, and acquisition and processing time increases. Which makes it important to test the efficiency of different TLS scanning combinations in different forest types. In this talk, different TLS combinations and their efficiency in forest information extraction from ground to canopy perspective are discussed.
Simon Mutterer, Clemens Blattert, Timothy Thrippleton, Jurij Diaci, Gal Fidej, Leo Bont, Janine Schweier: Managing European Alpine forests with close-to-nature forestry to improve climate change mitigation and multifunctionality 

Close-to-nature forestry (CNF) has a long tradition in European Alpine forest management, playing a crucial role in ensuring the continuous provision of biodiversity and forest ecosystem services, including protection against natural hazards. However, climate change is causing huge uncertainties about the future applicability of CNF in the Alpine region. The question arises as to whether current CNF practices are still suitable for adapting forests to climate change impacts while also meeting the increasing societal demands regarding Alpine forests, including their potential contribution to climate change mitigation.
To answer this question, we simulated forest development using the ForClim forest model at two Alpine study sites, together representing a large biogeographic gradient from high-elevation inner Alpine forests (Switzerland) to lower-elevation south-eastern Alpine forests (Slovenia). The simulations considered three climate scenarios (historical climate, SSP2-4.5 and SSP5-8.5) and six alternative management strategies, including both current CNF management practices and climate-adapted versions. Using a indicator based multi-criteria decision analysis framework, we assessed the joint impacts of climate and management on biodiversity and key ecosystem services of the investigated regions, including carbon sequestration (CS) inside and outside the forest ecosystem boundary.
The joint effects of climate change and CNF varied, both among and within the study sites along the biogeographical gradient. While CS was more resistant to climate change under current CNF at the south-eastern Alpine site, it was more sensitive at the inner Alpine site, where CS potentials decreased at lower elevations. This adverse effect could be partly mitigated by fostering the use of climate-adapted tree species. However, current CNF and adaptations of it did not meet multiple management objectives equally well: while protection from gravitation hazards and timber production also benefited from this silvicultural practice, biodiversity benefited from CNF variants with low-intensity or no management.
In conclusion, CNF has a high potential to continue fulfilling its crucial role in European Alpine forests. A differentiated approach will be needed in the future, however, to identify forest stands where adaptive measures are required, especially at sites particularly vulnerable to climate change. In combination with less intensively managed or unmanaged areas, CNF provides a management portfolio that will help European Alpine forests to meet the demands of future society.
25.3.2024 
Daniel Kükenbrink: Progress towards an operational inclusion of close range remote sensing in the Swiss NFI. 

National forest inventories (NFIs) are an important source of information to assess the state and dynamics of forest ecosystems. Traditional statistical forest inventory procedures are labour intensive, while the actual coverage of evaluated plot area is limited. Many forest parameters rely on assessments based on expert knowledge. These expert assessments can be subject to observer bias and hence may lack in robustness. Close range remote sensing (CRS) shows large potential for quantitative forest assessment. With recent sensor developments, the possibilities for an operational inclusion of CRS within an NFI increased. Especially mobile laser scanning (MLS) showed good performance both in terms of acquisition time and level of accuracy for the derivation of forest inventory relevant parameters (e.g. tree position, diameter at breast height (DBH)). However, extensive analysis on the robustness of data acquisition and feature extraction is needed to evaluate their suitability for an operational inclusion within the framework of an NFI.
In this presentation I will talk about the progress on the operational inclusion of CRS for the next cycle of the Swiss NFI. I will present most recent results on the robustness of CRS acquisitions as well as the next steps to be taken to assure a successful implementation of MLS in the Swiss NFI. Finally, I will talk about the potential applications and benefits of acquiring 3D point cloud data within an NFI.
Marco Ferretti: ICP Forests: facts, figures, and science. 

European forests represent an invaluable asset for wood production, biodiversity conservation and to combat climate change. Concern for the possible effects of transboundary air pollution on ecosystems, health and materials prompted the United Nations to establish the Air Convention in 1979 – the first international multi-lateral treaty to protect the environment. Within the Air Convention, the International Co-operative Programme for the Assessment and Monitoring of Air Pollution Effects on Forests (ICP Forests) was launched in 1985. The objectives were, and largely remain, to monitor spatio-temporal changes in forest condition across the UNECE region and to identify driver-response relationships. The methods adopted (i) cover from plot design to field and laboratory measurements, with comprehensive Quality Assurance/Quality Control; (ii) include a multi-level monitoring concept, with a probabilistic component (ca. 6000 Level I plots) and an intensive component (ca. 600 Level II plots); (iii) were all internationally agreed; and (iv) are continuously updated. Such a monitoring system remained internationally unrivalled to detect the impact of climate extremes and the combined effects of air pollution, climate change, forest management and biotic factors on key ecological features and processes of European forests. Here I will present the ICP Forests program together with some results.
Francesco Rota: Soil data quality and resolution matter when predicting woody plant species in temperate forests 

Soil properties influence plant physiology and growth, playing a fundamental role in shaping species niches in forest ecosystems. Here, we investigated the impact of soil data quality on the performance of climate-topography species distribution models (SDMs) of temperate forest woody plants. We compared models based on measured soil properties with those based on digitally mapped soil properties at different spatial resolutions (25m and 250m). We first calibrated SDMs with measured soil data and plant species presences and absences from plots in mature temperate forest stands. Then, we developed models using the same soil predictors, but extracted from digital soil maps at the nearest neighboring plots of the Swiss National Forestry Inventory. Our approach enabled a comprehensive assessment of the significance of soil data quality for 41 Swiss forest woody plant species. The predictive power of SDMs without soil information compared to those with soil information, as well as those with measured vs digitally mapped soil information at different spatial resolutions was evaluated with metrics of model performance and variable contribution. On average, performance of models with measured and digitally mapped soil properties was significantly improved over those without soil information. SDMs based on measured and high-resolution soil maps showed a higher performance, especially for species with an ‘extreme’ niche position (e.g. preference for high or low pH), compared to those using coarse-resolution (250m) soil information. Nevertheless, globally available soil maps can provide important predictors if no high-resolution soil maps are available. Moreover, among the tested soil predictors, pH and clay content of the topsoil layers improved the predictive power of SDMs for forest woody plants the most. Such improved model performance informs biodiversity modelling about the relevance of soil data quality in SDMs for species of temperate forest ecosystems. In conclusion, the incorporation of accurate soil information into SDMs becomes indispensable for making well-informed forecasts for guiding decisions in forest management, also when addressing the potential distribution shifts of woody plant species due to climate change.
5.12.2023 
Moritz Bruggisser: Nationwide forest edge structure characteristics derived from multitemporal airborne laser scanning data 

Forest edges represent the transition zone between the forest interior and the open countryside and provide several ecological functions. They contribute to biodiversity as habitats for plant and animal species, regulate fluxes of nutrients and pollutants between surrounding agricultural areas and the forest, or regulate the microclimate. To ensure maintenance of these edge functions, a reliable and frequent assessment and monitoring of their conditions is required, particularly for degraded edges which should be restored.
Regular, nationwide, publicly available airborne laser scanning (ALS) acquisitions (15-20 points/m2) as scheduled for Switzerland in the future are ideal to monitor forest edge conservation and renaturation efforts. To this means, we provided a map of forest edge structure characteristics for entire Switzerland (total forest edge length ~187,000 km). We derived canopy height variability, presence or absence of the shrub layer and forest edge slope from the latest nationwide ALS acquisition, thus information about the horizontal and vertical structure in the forest edge zone. These ALS structure metrics were chosen such that they are as close as possible to the definition of the forest edge metrics which are collected as part of the Swiss National Forest Inventory (NFI). Additionally, we derived light regime information and the horizontal visibility into the forest interior which are two metrics that go beyond standard parameters.
However, acquisition characteristics of different ALS flight campaigns differ regarding flight plans, time of acquisition, and sensor specifications. Variations in these acquisition characteristics result in differences in the point clouds (point densities and height distribution). Therefore, we put a particular emphasis on the evaluation of the robustness of the derived ALS metrics. The goal of our study is to verify that the detected differences in the ALS structure metrics reflect real structure changes in the forest edge instead of different acquisition characteristics.
Nataliia Rehush: TreeDetector – a fast and accurate approach for tree position and diameter retrieval from terrestrial LiDAR data 
Diameter at breast height (DBH) serves as a key attribute for a qualitative and quantitative evaluation of a tree and a forest, in general. Thus, DBH belongs to the most frequently derived tree attributes in forestry and is included in the measurement protocols of every national forest inventory (NFI). Recently, terrestrial LiDAR data have been actively investigated to extract various forest characteristics, including DBH. So far, various approaches have been developed. However, they often require extensive preprocessing and filtering of the point cloud and rely on expert-based iterative parameter optimisation. This results in a low level of automation and high time consumption. Recent advances in the field of computer vision show that deep learning methods are often highly efficient in extracting meaningful features from complex real-world data.
We propose a fully automated deep learning-based approach for a fast and accurate tree position and tree diameter retrieval from dense terrestrial LiDAR data. The approach relies on plot-level point clouds and requires very little data pre-processing. The backbone of the approach is an existing deep learning model (YOLOv5) retrained on our data. In addition to real-world terrestrial (TLS) and mobile (MLS) laser scanning data, we enhanced our training dataset with synthetic point clouds of simulated forest stands. The final model was tested on a “blind” dataset that included TLS and MLS point clouds with available reference data (DBH and tree position measured by experts during the field survey using calipers and a total station).
The results reveal a high performance of our approach in both speed and accuracy. The processing time for a forest plot was reduced to several minutes and a high tree detection rate was achieved. Thus, our approach can be used as an efficient tool for tree position and tree diameter retrieval from terrestrial LiDAR data.
Peter Stoll: Sampling with Partial Replacement in the Swiss National Forest Inventory (NFI 6)? 

National forest inventories (NFI) need to be cautiously adapted to new needs without jeopardizing the continuity of long time series. Up to NFI 5 (2018 - 2026), terrestrial forest sample plots in Switzerland were permanent. Permanently marked plots have been used since NFI 1 (1983 - 1985) raising questions about the representativeness of the original sample. Sampling with partial replacement (SPR) has repeatedly been proposed as alternative in order to ensure that samples remain representative. Moreover, replacing some permanent with temporary plots may make it easier to improve public accessibility of plot positions.
However, SPR was never adopted in Switzerland because of a potentially substantial loss in precision of change estimates and the added complexity in managing, handling and the estimation steps of the inventory.
Using re-sampling of Swiss NFI data and simulations, we found that 30 or even up to 50% of the permanent plots could be replaced by temporary plots without losing much precision in change estimates. On the other hand, bias of change estimates increased with increasing fraction of replaced plots and an anticipated gain in precision of state estimates was marginal.
Cautious recommendation: 10% of the permanent plots could be replaced by temporary plots to see how representative the original sample still is without jeopardizing the continuity of a long (> 40 years) time series. Even better would be to add 10% temporary plots to the existing set of permanent plots and thoroughly evaluate potential consequences of sacrificing 10% permanent plots after completion of NFI 6.
27.9.2023 
Meinrad Abegg: Challenges and Opportunities in Retrieving Forest Allometric Traits Using Close Range Sensing for Allometric Modeling 

Allometric models play a crucial role in forest monitoring, e.g., converting diameter measurements into biomass. Many studies show the potential of close-range remote sensing (CRS) technologies in forest ecosystem assessment. However, allometric models are still based on traditional measurements, and there is no established procedure to include CRS in developing new allometric models. Within the Cost Action 3DForEcoTech, a wiki will be developed to document the challenges and opportunities in collecting and analyzing forest allometric data using different CRS techniques for comparing with classical approaches and develop new advanced models.
The wiki's main objective is to provide practitioners with a hands-on guideline on the steps to be taken combining existing allometric models with CRS technologies. The wiki contains a general introduction to approaching a CRS survey. Additionally, an overview of data, collections and models for sharing are compiled to facilitate collaboration. Specific information about scanners, including TLS, MLS, photogrammetric, and UAVLS point clouds, is documented and reviewed in detail.
The link between CRS features and scanner types provides a comprehensive overview of the potential connections between the two. Firstly, traditional allometries are evaluated regarding input datasets, tree components or statistics considerations and goodness of fit statistics. Secondly, the way forward with CRS data is discussed in terms of sample types, ground truth, and new CRS input data, emphasizing the importance of explanatory variables and their connection with the acquisition approach.
Validation considerations are also discussed in terms of the conditional use case. This open document will support future internationally standardized forest data collection and model development for a broad range of purposes.
Hristina Hristova: Viewing the Forest in 3D: How Stereo Spherical Videos Enable Low-Cost Reconstruction of Forest Plots 

Understanding and monitoring the surrounding environment depend increasingly on its 3D representation. However, the high costs of 3D data equipment limit its wide usage. At the same time, low-cost sensor solutions have increased in popularity thanks to their lightweight setup and relatively user-friendly interfaces. Here, we present a novel low-cost approach for 3D point cloud reconstruction based on stereo spherical videos. Traditionally, visually coded targets, set up during data acquisition, provide the scale of a point cloud built from a monocular video. By introducing a stereo-video system featuring two spherical cameras and a known baseline distance, the proposed approach eliminates the need for visually coded targets and reduces manual work. We studied the ability of our approach to generate 3D point clouds in a highly structured forest environment represented by three 50m × 50m forest plots. We assessed the quality of the generated videogrammetric point clouds using three baseline distances, i.e., 20, 40, and 60 cm, with Terrestrial Laser Scanning (TLS) data used as a reference. Our results show that the proposed approach allows for feasible 3D reconstruction of complex forest plots. A baseline of 60 cm enabled a correct detection of more than 65% of the trees within the forest plots, producing an average tree position error between 30 cm and 50 cm and clearly outperforming a monocular-video approach. A Multiscale Model-to-Model Cloud (M3C2) analysis provides signed distances between the generated point cloud and the reference TLS data with zero mean and 1 m standard deviation. In this paper, we reveal the high potential of the proposed stereo-video approach and its advantages over monocular videogrammetry, for accurately recovering 3D representations of complex forest plots and retrieving key forest features.
19.6.2023 
Petia Nikolova: Das Projekt «Gebirgswaldverjüngung» stellt sich vor 
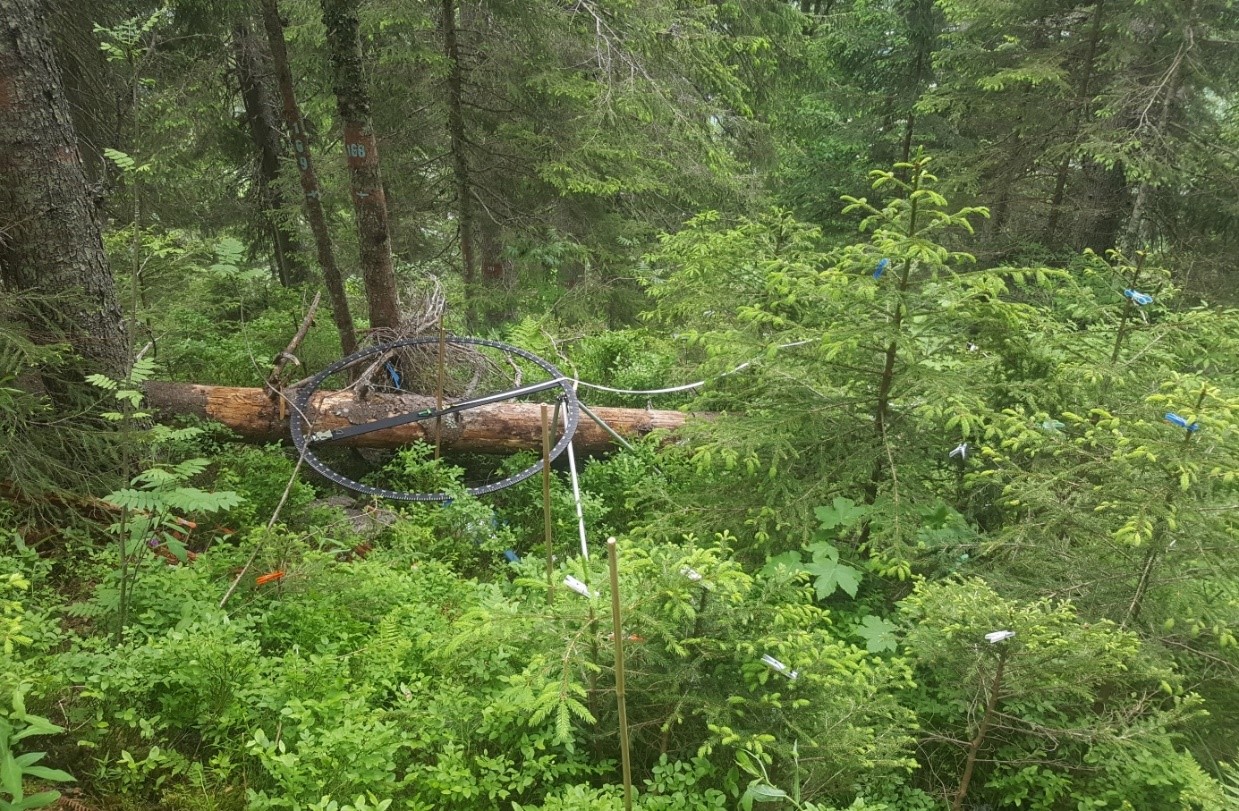
Das Projekt «Gebirgswaldverjüngung» hat das langfristige Ziel, innert ca. 20 Jahren fachliche Grundlagen zu schaffen, damit die Naturverjüngung im Gebirgswald wirksam waldbaulich gefördert werden kann. Zudem sollen praxistaugliche Hilfen zur Beurteilung der Naturverjüngung bereitgestellt werden. In der Projektphase II (2020-2023) werden 10 Versuchsflächen in Fichten- und Fichten-Tannenwäldern fertig eingerichtet, dort waldbauliche Langzeit-Experimente gestartet und aus wiederholten Inventuren von Bestand und Verjüngung Ergebnisse zur Entwicklung der Naturverjüngung gewonnen. Ziel des Vortrags ist, den aktuellen Stand des Projektes vorzustellen und Interessenten für wissenschaftliche Kooperationen zu gewinnen. Es werden Ideen zu möglichen Begleitstudien zu Teilprozessen der Verjüngung vorgestellt.
Daniel Scherrer: Berechnung der Naturnähe der Baumartenmischung auf LFI-Probeflächen 
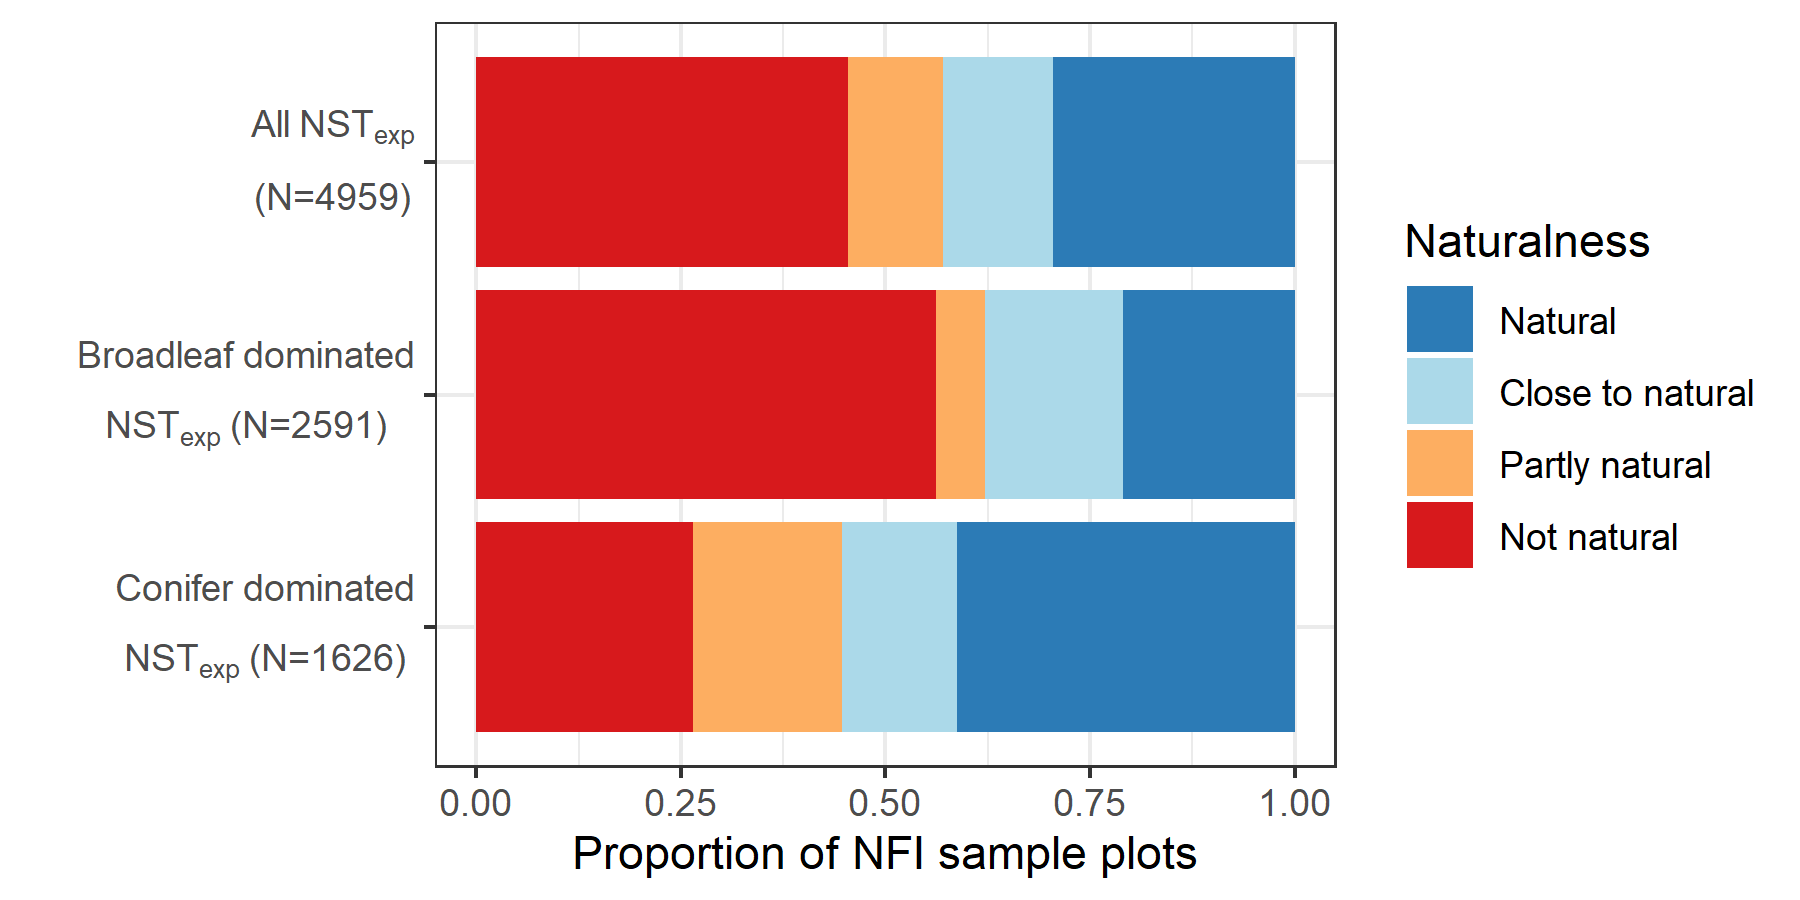
Viele waldbauliche Beurteilungen (z.B. NaiS) und subsequente waldbauliche Massnahmen oder Bewirtschaftungsformen (z.B. Naturnaher Waldbau) basieren auf der Hypothese, dass naturnahe Wälder eine ‘optimale’ Resistenz und Resilienz gegenüber Störungen aufweisen. Ist dies wirklich der Fall? Die repräsentativen Daten des LFI und die neu verfügbaren Angaben zu den Waldstandorttypen liefern erstmals eine optimale Datenbasis dies zu überprüfen. Wie wirkt sich der gegenwärtige und zukünftige Klimawandel auf die Naturnähe von Wäldern aus? Was sind die grössten Herausforderungen, um die Wälder auch in den kommenden 100 Jahren naturnah zu gestalten? Wo besteht der grösste Handlungsbedarf für waldbauliche Eingriffe zur Anpassung der Baumartenzusammensetzung, um eine hohe Naturnähe und kontinuierliche prioritäre Waldfunktionen sicherzustellen?
6.12.2022 
Moritz Bruggisser, Zuyuan Wang, Lars T. Waser, Christian Ginzler - Assessing forest edge structure on national scale for spatial and temporal edge quality change assessments 

Forest edges represent the transition zone between open land and the forest interior and fulfil important ecological functions, e.g., for the conservation of biodiversity or the regulation of the microclimate. However, forest edges are under increasing pressure due to intensified agriculture and forest management. In order to support actions for the functioning of forest edges through management activities, assessing the state and changes of forest edges is required.
The aim of our project is to assess horizontal and vertical structure variations of forest edges at the national coverage of Switzerland (41,285 km2).
We use the latest freely available nationwide airborne laser scanning (ALS) based SwissSurface3D model with a point density of 15-20 points/m2, and if available also additional very dense, multitemporal ALS data. The high point densities enable to assess both horizontal and vertical structure at the forest edges. To do so, we compute the most relevant forest edge structure features, including vegetation height distributions, the shrub layer and herbaceous boarders, number of vegetation layers, vegetation height gradient from open land to forest interior, horizontal canopy information such as canopy cover and canopy gaps, vertical density of the canopy layer within the forest edge area, and stem density.
Based on a previous study (Wang et al. 2020), we proposed a method using non-parametric Kernel Density Estimation (KDE) to describe forest edges from vegetation height model data. Since this KDE-based approach is independent from specific site conditions, we adapted this approach by implementing additional information on land-use intensity close to the forest, topographic information and structure of the forest interior. This enables to automatically quantify and assess structural changes of forest edges at national coverage and understand drivers of forest edge structure variability. Moreover, our analysis also includes the quantification of changes of the forest edges in areas where multi-temporal ALS data sets are available.
The proposed approach provides all required information to identify forest edge areas at a national coverage, which are at severe threat of degradation and thus require management intervention. In this way, the quality of forest edges can be preserved or improved for important ecosystem services.
Bronwyn Price - Spatially explicit models of forest attributes for Switzerland: Do we need vegetation height models? 

Spatially explicit national-extent maps of forest attributes such as above ground biomass (AGB), basal area and stem density are invaluable information sources for a variety of purposes including carbon accounting, biodiversity assessment and forestry planning. The increasing availability of high spatial and temporal resolution earth observation data at broad spatial extents (regional-national-continental-global), in combination with national forest inventory field data, offers opportunities to develop generalised methods and produce high resolution forest attribute maps at national extents. While high resolution vegetation height models (VHMs), derived from either airborne LiDAR data or digital photogrammetry, have been shown to be very good predictors of forest attributes such as AGB, acquisition of these data can be costly and as such they are not always available at national extents and are often not up to date. Thus, attention has also turned to modelling forest attributes from openly available datasets such as the Copernicus Sentinel-1/-2 (S1, S2) missions.
In this work we compare models of forest attributes based on the high resolution VHM of Switzerland (derived from stereo aerial imagery) to those based on a coarser resolution S2 VHM, and models with no VHM but metrics derived from S2 imagery (growing season metrics of vegetation indices and image texture). NFI field plot data allows us to model the forest attributes AGB, growing stock, number of stems per hectare and basal area, in a spatially explicit manner across Swiss forests at 25m resolution (equivalent to NFI plot size). Additional explanatory variables include the dominant leaf type dataset (also derived from S1/S2 data), soil properties derived from digital soil modelling, climatic variables, and topographical variables.
For each forest attribute, first we pre-select a subset of best predictors, assessing individual predictive power of each explanatory variable in a repeated split sample cross-validation, with pairwise exclusion of collinear variables. A variety of modelling approaches were tested: linear modelling, generalized linear models (GLM), random forest (RF) and boosted regression. Random forest models were the best performing model type across all response variables. The predictive power of the best model for stems per hectare remains relatively low, with approximately 39% variance explained by a RF model, but was reasonable for all other target variables (61% - 68% variance explained). The explanatory power of the RF models is considerably higher for the NFI VHM dependant models than for those based on the coarser resolution S2 VHM, which in turn were considerably higher than models with no VHM variables. However, the additional non-VHM variables offer substantial improvements in explanatory power as the performance of models without these variables was markedly lower.
Tiziana Koch - Assessing variations in the phenology of tree species in Swiss forests with Sentinel-2 
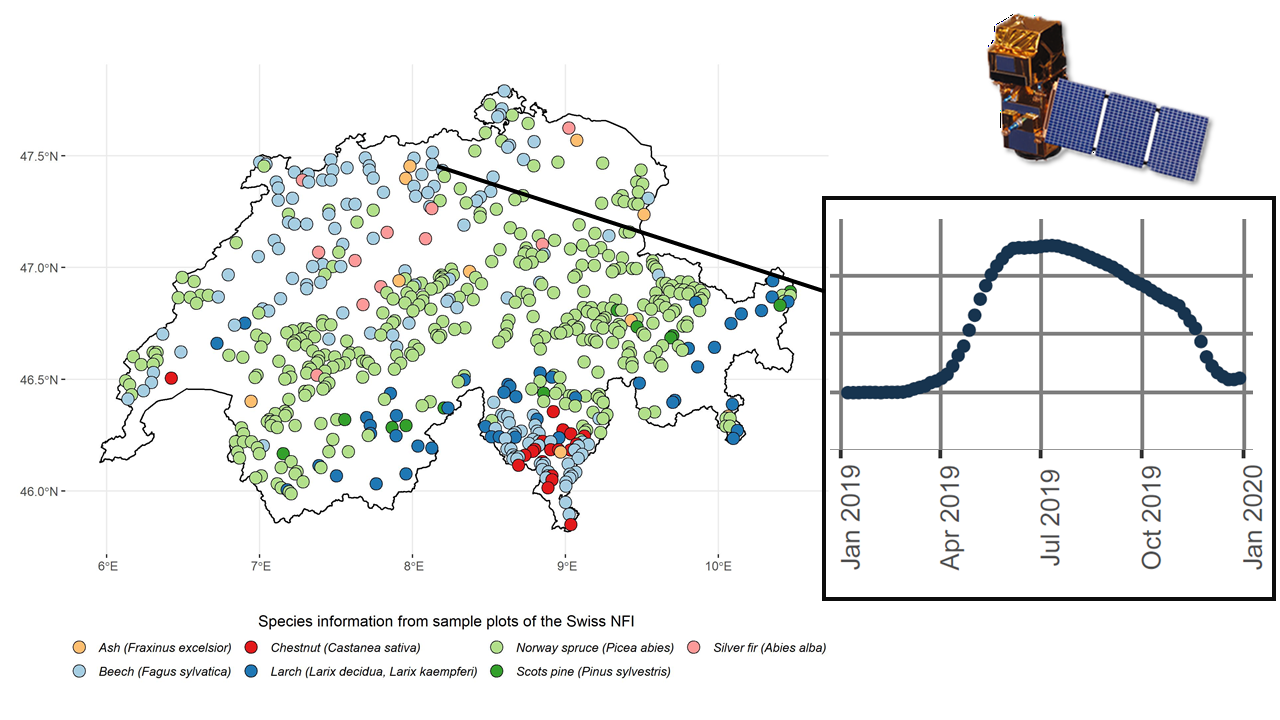
Tree phenology, the study of cyclical biological events of trees, including the timing of leaf unfolding and leaf fall, is closely linked to climatic conditions. Multi-temporal satellite remote sensing allows extensive mapping of phenological information that due to its operating scale relates to land surface phenology representing the phenology of many species. Nowadays with the operating scale of Sentinel-2 species-specific phenology can be derived. We hypothesize that there is great potential to enhance phenological monitoring through a more detailed analysis of the inter- and intra-species specific variation of phenology from remote sensing data.
Our study focuses on forest ecosystems of Switzerland with its complex topography and environmental gradients (elevations between 193 and 4,634 m.a.s.l.), causing significantly varying phenological patterns of individual tree species across six main biogeographical regions in the country with an area of 41,285 km2. We link terrestrial data of tree species from the Swiss National Forest Inventory (NFI) with Sentinel-2 time series for the year 2019 and analyze the variations of these tree species in a spatial, temporal and spectral context. Due to the higher abundance and appearance on 95 % of the NFI plots, we limit our assessment to Beech (Fagus sylvatica), Ash (Fraxinus excelsior), Chestnut (Castanea sativa), Larch (Larix decidua, Larix kaempferi), Norway spruce (Picea abies), Scots pine (Pinus sylvestris) and Silver fir (Abies alba).
Our results can potentially serve as a new baseline for extensive phenological observations of forest tree species and can be used as a benchmark for large-scale tree species classifications. The knowledge about phenological patterns may further be used to adjust forest management strategies to optimize timber availability, biodiversity richness, or carbon storage.
28.9.2022 
Ross Shackleton - SwissAIM: An update on progress 

Due to current rapid social-ecological changes, there is a need to update forest monitoring and inventorying initiatives. To address this need, the SwissAIM (an Advanced Inventorying and Monitoring System for Swiss Forests) initiative was established in 2020 through an initial launch workshop. The SwissAIM initiative aims to develop an “integrated terrestrial and remote sensing observation system based on a permanent panel of enhanced NFI plots. It will provide high-quality periodical (intra-annual, annual, multi-annual) results with known statistical errors for the status, change and response of forests to biotic and abiotic drivers”.
This presentation overviews the progress in the development of SwissAIM to date. In particular, some of the 92 questions and 52 variables of interest suggested for SwissAIM will be discussed. Broadly speaking we highlight that SwissAIM would better contribute to assessing the status and change, processes and dynamics of swiss forests and advancing forest monitoring tools and techniques.
A preliminary plot design for SwissAIM will also be presented. This design is based largely on the current Swiss NFI plot design, however, with many novel additions for SwissAIM. In particular, these novel additions relate to initiating ground vegetation surveys on the central circular plot of the Swiss NFI, adding new plots for gap regeneration assessments, the addition of terrestrial laser scanning and drone-based measures with thin the Swiss NFI interpretation area, and the inclusion of five new sub-plots in the interpretation area for minimally destructive and invasive sampling. In these five sub-plots, new measures relate tree and soil samples for nutrient and eDNA analysis, the installation of conspicuous and underground sensors and litter sampling.
Furthermore, we present the results of the power analyses we conducted to identify required sample sizes (n) to assess forest change. We used three variables to do this. To assess change at a power level of 80% and an alpha value of 0.05, 157 plots would be needed to assess multi-annual changes in species richness, 245 for annual changes in the basal area, and 403 plots for assessing annual changes in defoliation. Fewer plots would be needed to assess the stats of forests and for modelling. Based on this SwissAIM should be conducted on an 8x8 km grid or denser.
We conclude by discussing future directions for the SwissAIM initiative, in particular, starting engagements with relevant stakeholders across Switzerland and prototyping the plot design and methods.
Roman Flury - Spatial Feature Identification to Evaluate Biodiversity Indices on Different Scales 
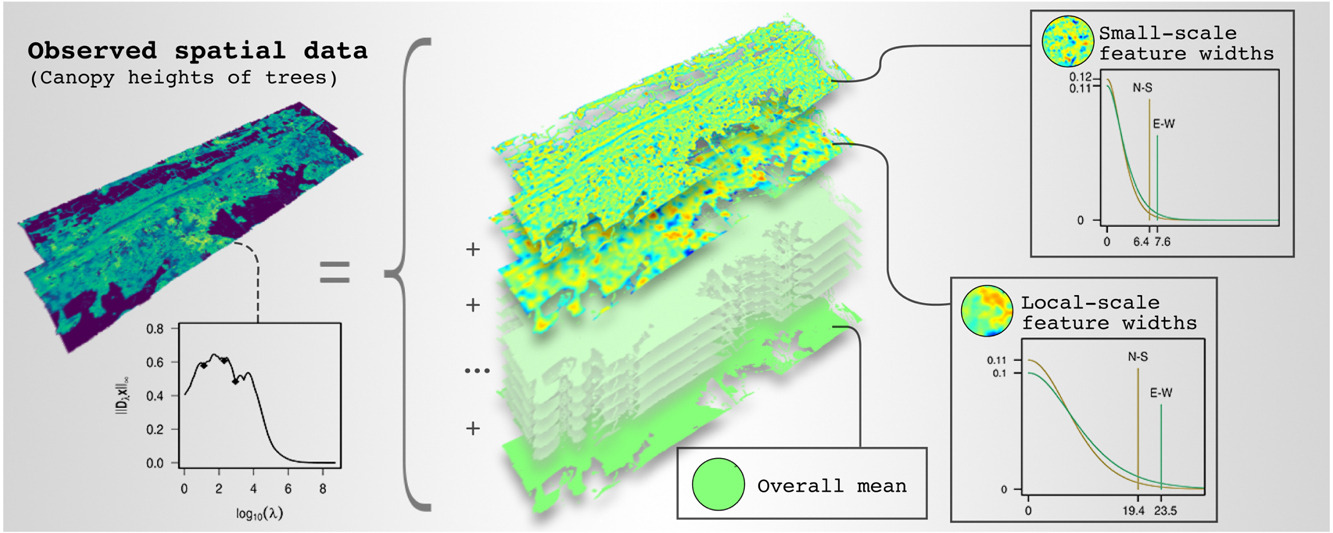
Dominant features of spatial data are connected structures or patterns that emerge from location-based variation and manifest at specific scales. A sequential application of scale-space multiresolution decomposition and covariance function estimation can be used to identify such dominant features. The decomposition separates data into additive components and enables the recognition of their dominant features. A general scale-space multiresolution decomposition method is developed for different spatial data types, where the underlying model includes a precision and spatial-weight matrix to capture spatial correlation. The data are separated into their components by smoothing on different scales, such that larger scales have longer spatial correlation ranges. Covariance function estimation can be used to describe attributes in spatial data. Therefore, such functions are estimated for each component to determine, e.g., its effective range, which assesses the width-extent of the dominant feature. Finally, Bayesian analysis enables the inference of identified dominant features and to judge whether these are credibly different. The efficient implementation of the method relies mainly on a sparse-matrix data structure and algorithms. This method can lead to new insights in disciplines that use spatial data, as exemplified by identifying the dominant features in a forest dataset. In that application, the width-extents of the dominant features have an ecological interpretation, namely the species interaction range, and their estimates support the derivation of ecosystem properties such as biodiversity indices.
For more information see: https://doi.org/10.1016/j.spasta.2020.100483
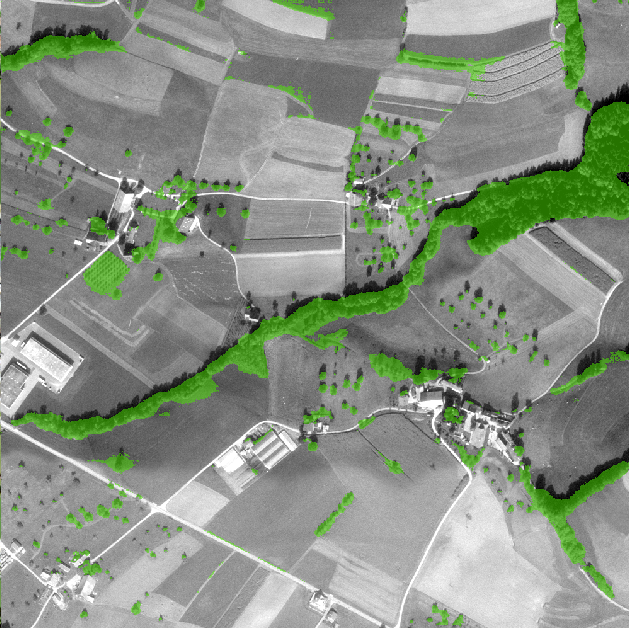
Zuyuan Wang - From historical aerial images to informative woody plant changes in long term mountain treeline ecotones research using CNNs 
Assessing changes of woody plants is a prerequisite for monitoring environmental resources as well as characterizing treeline dynamic.
In this context, a broad range of methods have been developed over the last decades that include dendro-ecological techniques, aerial photograph assessments, field surveys, remote sensing data integrated historical maps, etc.
Long-term dynamics of up to 30 years at coarse spatial resolution have been assessed using time series obtained from MODIS and Landsat data.
Meanwhile, historical black-and-white (B&W) aerial images have been recognized as an important source of information for assessing vegetation dynamics with high spatial resolution – although their use is still considered to be relatively limited.
In Switzerland, the archive of historical B&W aerial images goes back to the 1920ies. The Federal Office of Topography (swisstopo) scanned and oriented the data sets from nationwide flights starting from 1979. With these data sets a continuous assessment of vegetation cover change over an increasing time span becomes feasible.
In our previous study (Wang et al. 2022), we used a deep learning approach to detect changes in woody vegetation along alpine treeline ecotones between 1980 and 2010 for two biogeographic areas in the Swiss Alps using the three vegetation structure classes “dense forest”, “group of trees” and “others”. A comparison with visual image interpretation revealed generally high agreement for the class “dense forest” and lower agreement for the class “group of trees”. The use of single-band B&W images was challenging for images from all dates due to the heterogeneity of the image patches, i.e. spectral distortion, brightness and contrast. Another potential challenge was related to the fuzzy boundary for the definition of the three classes.
The present study builds up on these findings and aims to assess woody plant changes in treeline ecotones for 170 sample plot areas (1km×1km) distributed over the whole Switzerland. The main achievements are: 1) adopting suitable data augmentation as an effective method of supplementing the training samples, 2) modification of the CNN models to include short-range, mid-range and long-range semantic information at different stages of the network in order to generate a robust feature descriptor, which preserves the spatial details. Moreover, heterogeneous instead of homogeneous transfer leaning is applied in order to incorporating human knowledge by correlating different feature spaces.
With this new method negative performance is quantitatively reduced, including a discriminator that assigns different weights and uses an iterative processing, in order to detect the negative transfer.
The study reveals that archived historical B&W images in combination with CNNs have great potential to assess changes in woody vegetation cover along alpine treeline ecotones at the national coverage of Switzerland over the last decades.
For more information see: https://doi.org/10.3390/rs14092135
16.6.2022 (FOREMA day at Waldlabor) 
Hristina Hristova - Estimating distance to trees in NFI 360-degree images 

Knowledge about forest stand characteristics (i.e., spatial distributions of trees, tree size distributions, etc.) is crucial for forest management and monitoring, evaluating the protective function of forests, etc. These features are traditionally derived by manual field sampling performed by the NFI. Except for being time-consuming, field sampling can also be expensive when carried out in a large forest area.
Deriving forest stand features for large areas is essential to properly monitor the forest’s current state, allowing for knowledge-based management decisions. The collection of forest data could be aided by close-range remote sensing techniques, such as Terrestrial Laser Scanning (TLS) and imaging. With the use of 360° imagery, efforts can be made to estimate tree features, such as distance, diameter, and height. Recently the interest in 3D reconstruction from monocular images has increased thanks to the introduction of deep networks. Monocular depth recovery benefits from the newest deep learning (DL) architectures and provides an alternative to traditional stereo approaches.
In our work, we aim to recover the absolute distance from the camera to detectable trees in the NFI 360° forest images. We achieve it by training our own DL model on this set of 360° forest images. We first show that related work fails to produce plausible results for forest imagery. Reference methods are trained on large data sets and achieve outstanding precision on the corresponding test sets. Despite that, their training sets contain a limited number of forest images which may hinder their performance.
We consider the specifics of the forest environment and propose a novel framework for depth prediction in forest images. Our method recovers the forest 3D structure from an input RGB image and a sparse depth channel. We utilize high-resolution TLS to collect the training data for our model and compute ground-truth depths. To capture the initial high-quality 360° RGB-D images in various NFI plots, we collected data using a FARO Focus 3D 120S terrestrial laser scanner with an integrated camera. We captured the RGB data using the integrated camera and derived the depth channel D from the point cloud data resulting from the scanning. After the data collection, we de-noised the point clouds by removing unstable objects, such as leaves and thin branches. We then merged the depth information with the RGB images from the integrated camera to create the initial 360° RGB-D images comprising our forest data set.
Our proposed model takes forest (360°) RGB-D images as input, where the depth channel is a sparse sampling of the ground-truth depth. For feature extraction, we trained ResNet-18 with a loss function that depends on the L1 depth distance, gradient loss, and normal loss. The model was trained for 120 epochs with an adaptive learning rate with an initial value of 0.1. Our analysis shows that our depth maps are visually the closest to the ground truth and our predictions are highly correlated to the true depth, with an absolute error of 0.89 m for 1000 input samples.
Esther Thürig and Aline Bornand - How much biomass does a tree contain? - Truth versus model 
How much biomass does a tree contain? - Truth versus model
In times of climate and energy change, the sequestration of carbon (C) and the provision of biomass are important ecosystem services (ES) of the forest. At WSL, much data is available to estimate stemwood volume, but no ground-truth data is available to directly model total aboveground biomass on individual trees. Moreover, new measurement methods such as laser technology offer previously unattainable possibilities for modelling above-ground biomass.
In the "Swiss Biomass" project, both existing and new, innovative measurement methods are being evaluated in order to fill these data gaps. The aim is to be able to determine the biomass of individual trees more precisely using non-destructive measurement methods. These biomass estimates are central for the greenhouse gas inventory, Kyoto reporting and for the estimation of wood resources and bioenergy potentials.
In an internally WSL-funded pilot project, different measurement methods were tested and evaluated using two stands. The old-growth stand was completely surveyed using the non-destructive measurement methods Lidar (air and ground-based) and traditional forest surveys. During felling, about 36 trees in each stand were measured lying section by section, the weight of the whole biomass was determined with a crane scale, and 5 stem slices were taken from each. The stem slices were weighed (fresh weight), brought to the WSL and further processed there to determine the fresh volume, dry volume and dry weight.
A PhD study evaluates several approaches for estimating above-ground tree volume, using destructive measurements as a ground-truth reference and ground-based lidar point cloud data as an explanatory basis. One approach derives geometric tree attributes directly from the point cloud, e.g. crown diameter and length or convex hull volume. Another approach extracts stem diameters at regular height intervals from the point cloud and constructs stem regeneration curves for each tree. A more complex approach is called quantitative structural model (QSM) and involves reconstructing the entire morphological structure of a given tree with cylindrical shapes. Given a complete point cloud, this allows a direct and detailed estimate of the total volume.
Since the end of 2021, the project has been in the second phase. Six more forest stands are being sampled, financed by the FOEN. The first results are expected towards the end of 2023.
Peter Brang, Kathrin Streit - Experimental plantations of tree species adapted to future climates 
A warmer climate with drier summers will affect the climatic suitability of tree species in their current habitat and, subsequently, future ecosystem services. Forest managers have started to respond with assisted migration and assisted gene flow, but important fundamentals are lacking for their implementation. Therefore, the Experimental plantation project was initiated in 2018 to find out which factors determine mortality, health and growth of tree species and provenances along large environmental gradients. In its frame a network of 59 experimental plantations is established throughout Switzerland as a joint effort of WSL, FOEN, cantonal forest services, forest managers and forest owners. 18 tree species are tested, including the most important tree species like silver fir, Norway spruce, European beech, oaks and maples. For each species, 7 provenances are tested, with seed from Swiss populations, but with some seed sources originating from the dry-warm edge of their range. At present, 40 plantations have been established.
24.3.2022 
Beate Kittl - What's new(s)? How your research makes the headlines 
What's new(s)? WSL media officer Beate Kittl explained what a WSL news is and how your research finds its way to the greater public. What are the criteria? What should you do? Find all the information on the intranet (for WSL members only).
Florian Zellweger - Remote sensing advances forest microclimate mapping across Switzerland 

Forest microclimates contrast strongly with the climate outside forests. To fully understand and better predict how forests' functions and biodiversity relate to climate and climate change, microclimates need to be integrated into ecological research. We have set up a forest temperature network across Switzerland and combine our measurements with latest remote sensing data to predict forest microclimates for the past, present and future. Preliminary results show that the structure of the canopy and the related radiation regimes play a key role in driving small scale variation in forest temperatures close to the ground and in the topsoil. Our approach can now be used to estimate the effects of different forest management and disturbance regimes on microclimates, which helps to better understand how our forests will be affected by the combined effect