20.04.2020 | Logbook
Author 
A recent experiment saw WSL ecologist Yann Vitasse pick up a paintbrush and paint the buds of saplings black and white to gain an understanding of how the microclimate inside the buds affects when leaf emergence occurs. He tells us more in this logbook entry.
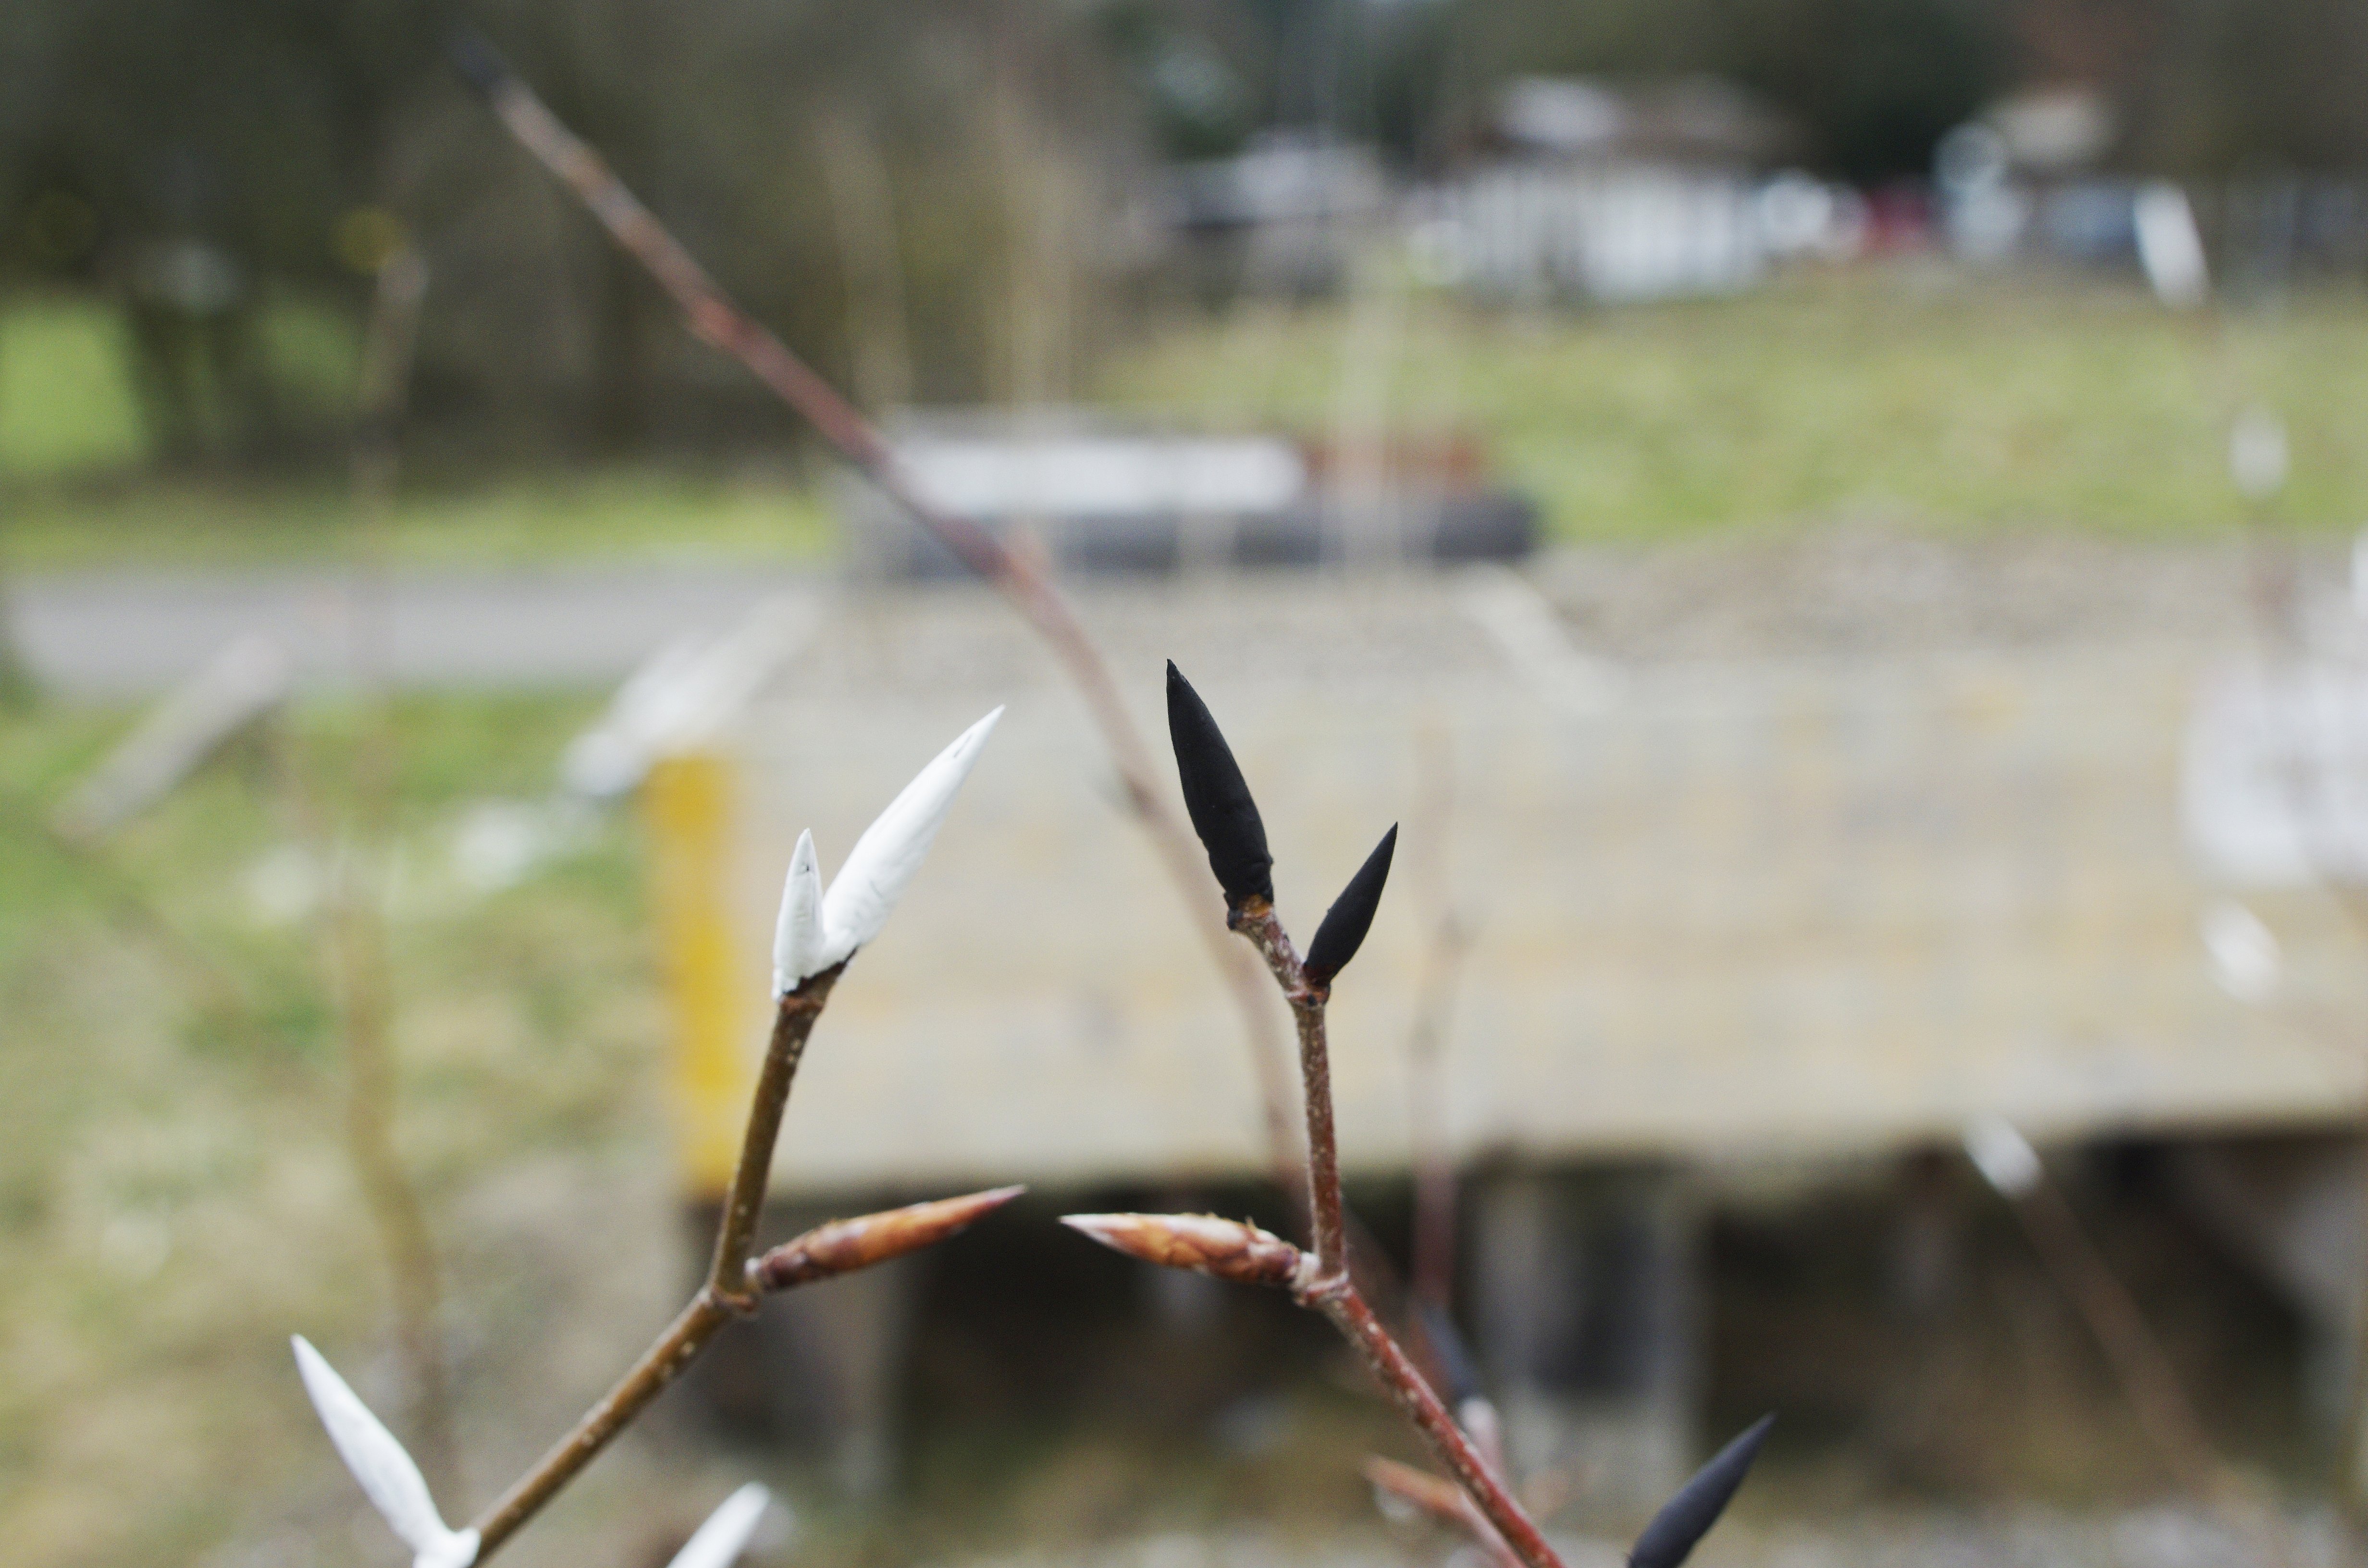
When, a short time ago, I asked a paint dealer for a paint that would be suitable for tree buds, he probably found this rather odd – or maybe he just thought I was a land artist. In fact, I was painting the tips of saplings black or white for purely scientific reasons. This artistic experiment is taking place in wooden boxes on the WSL site.
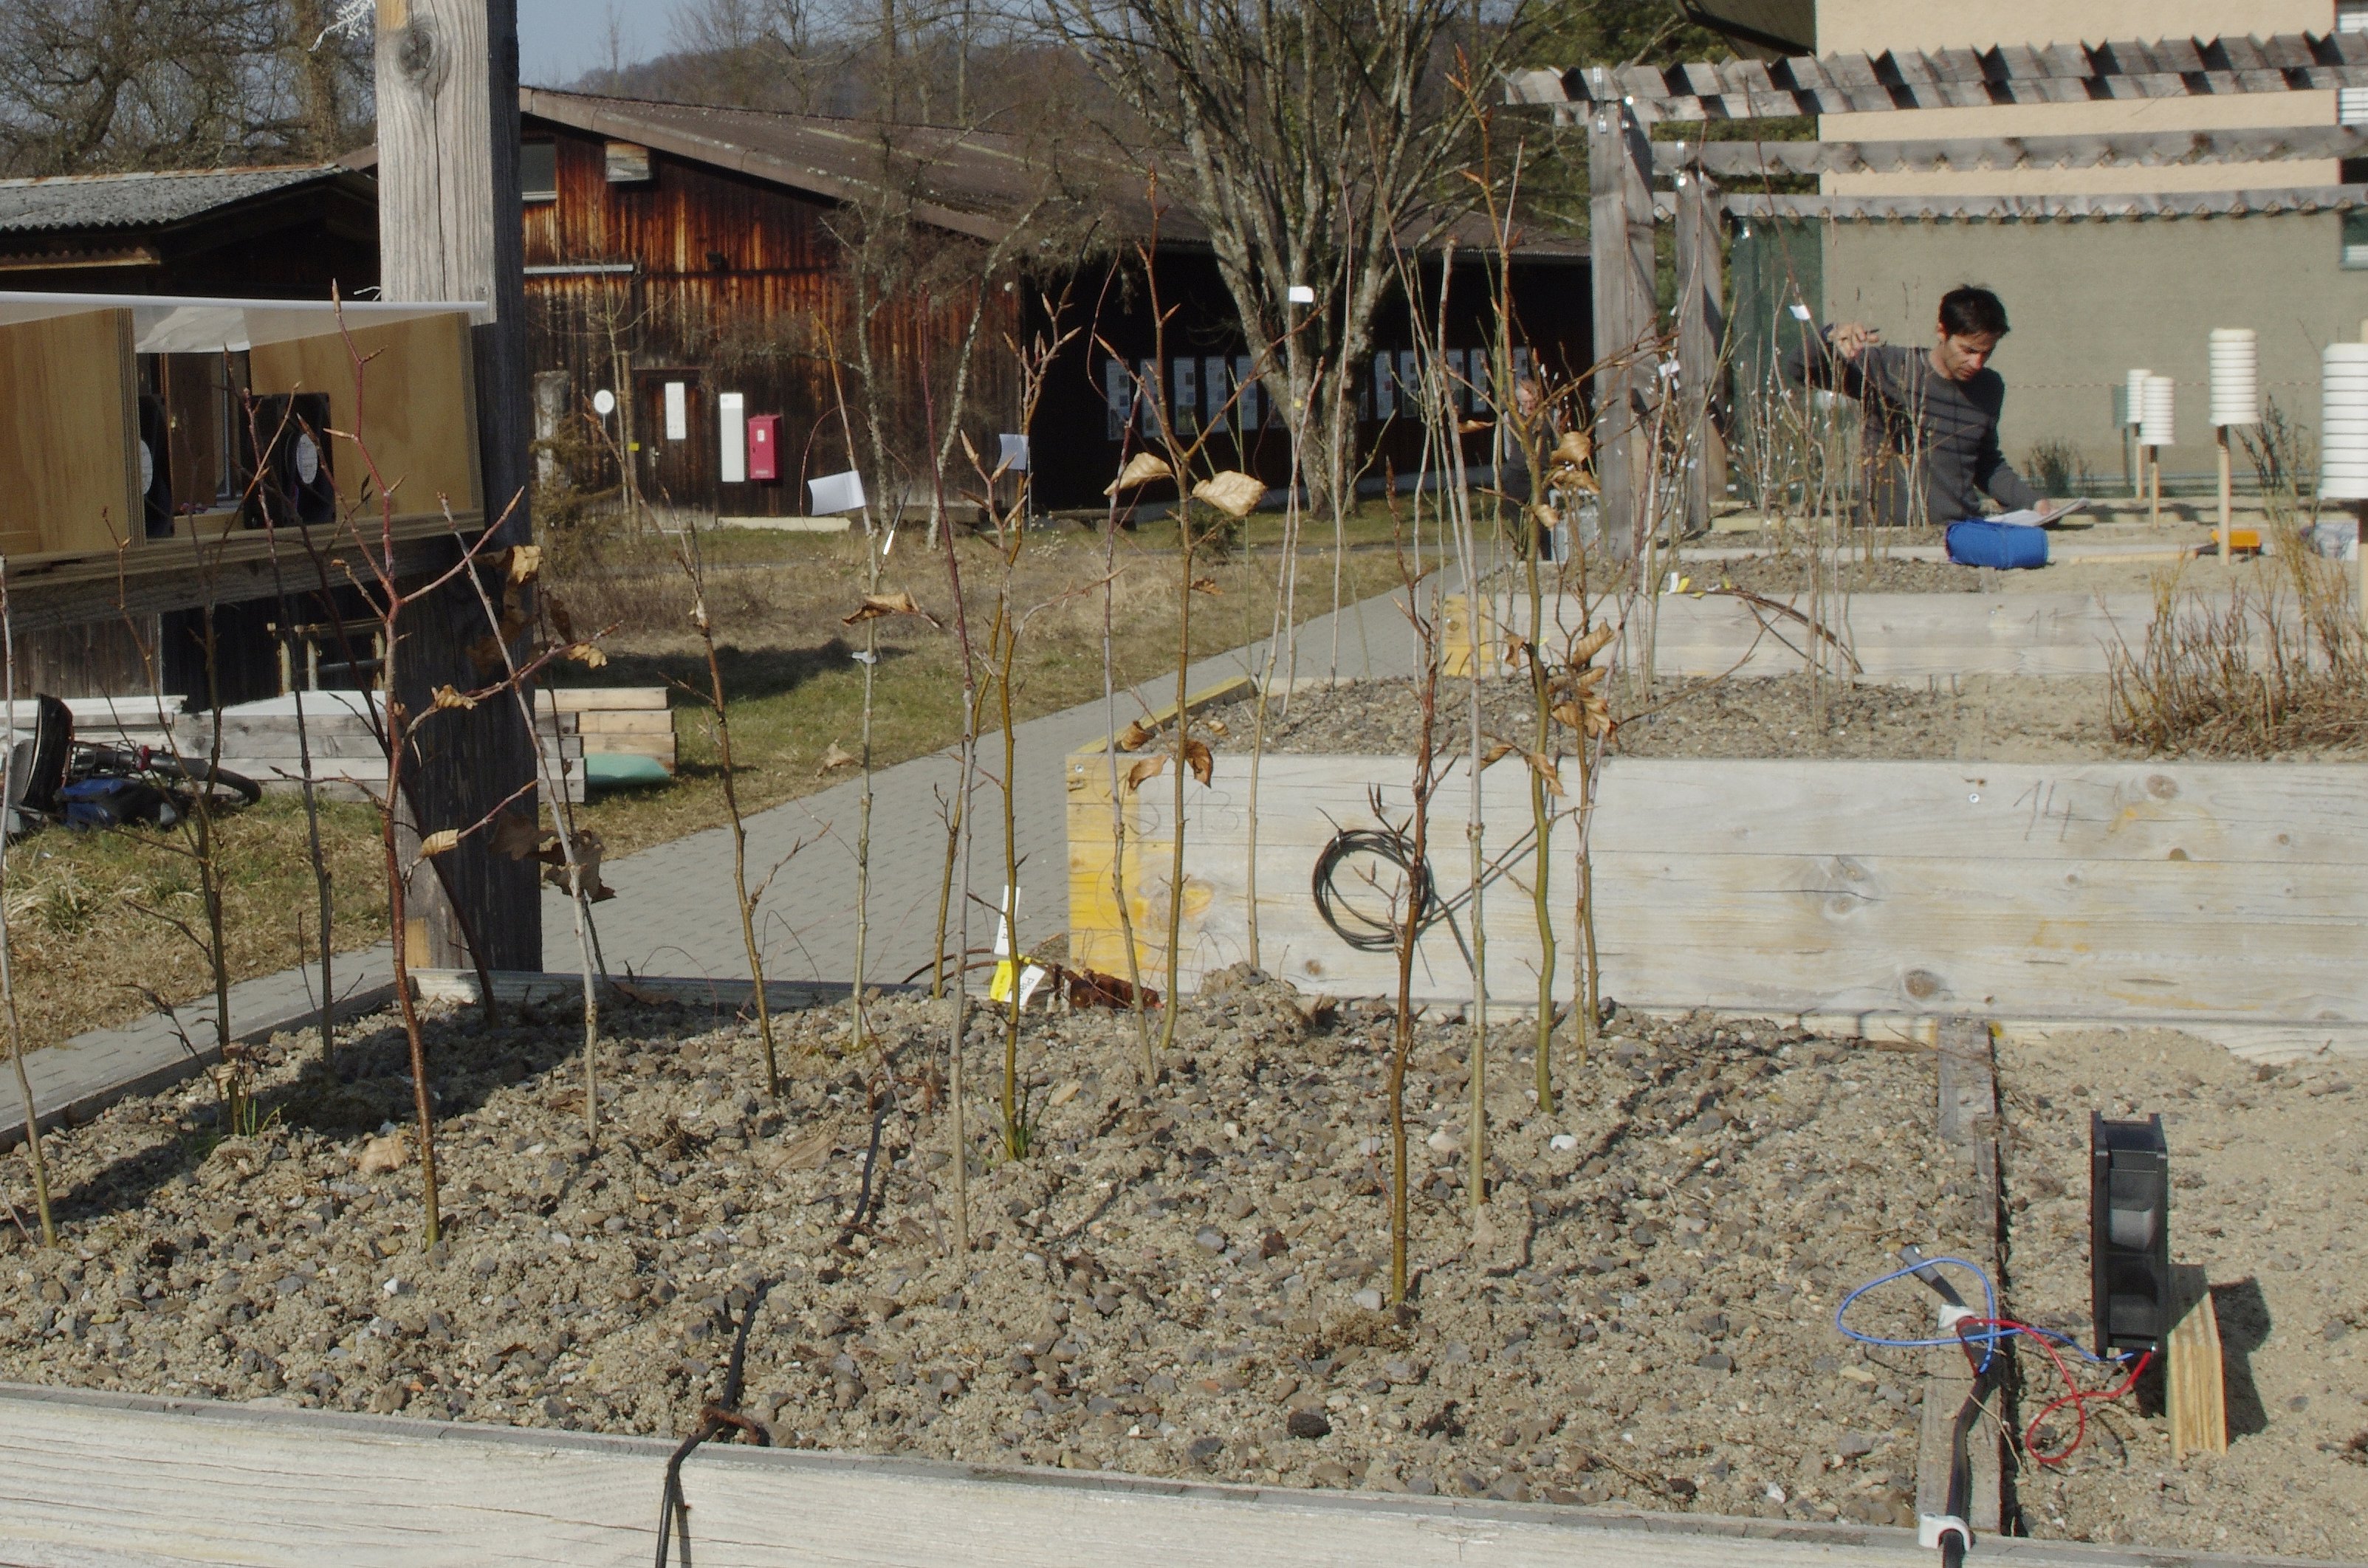
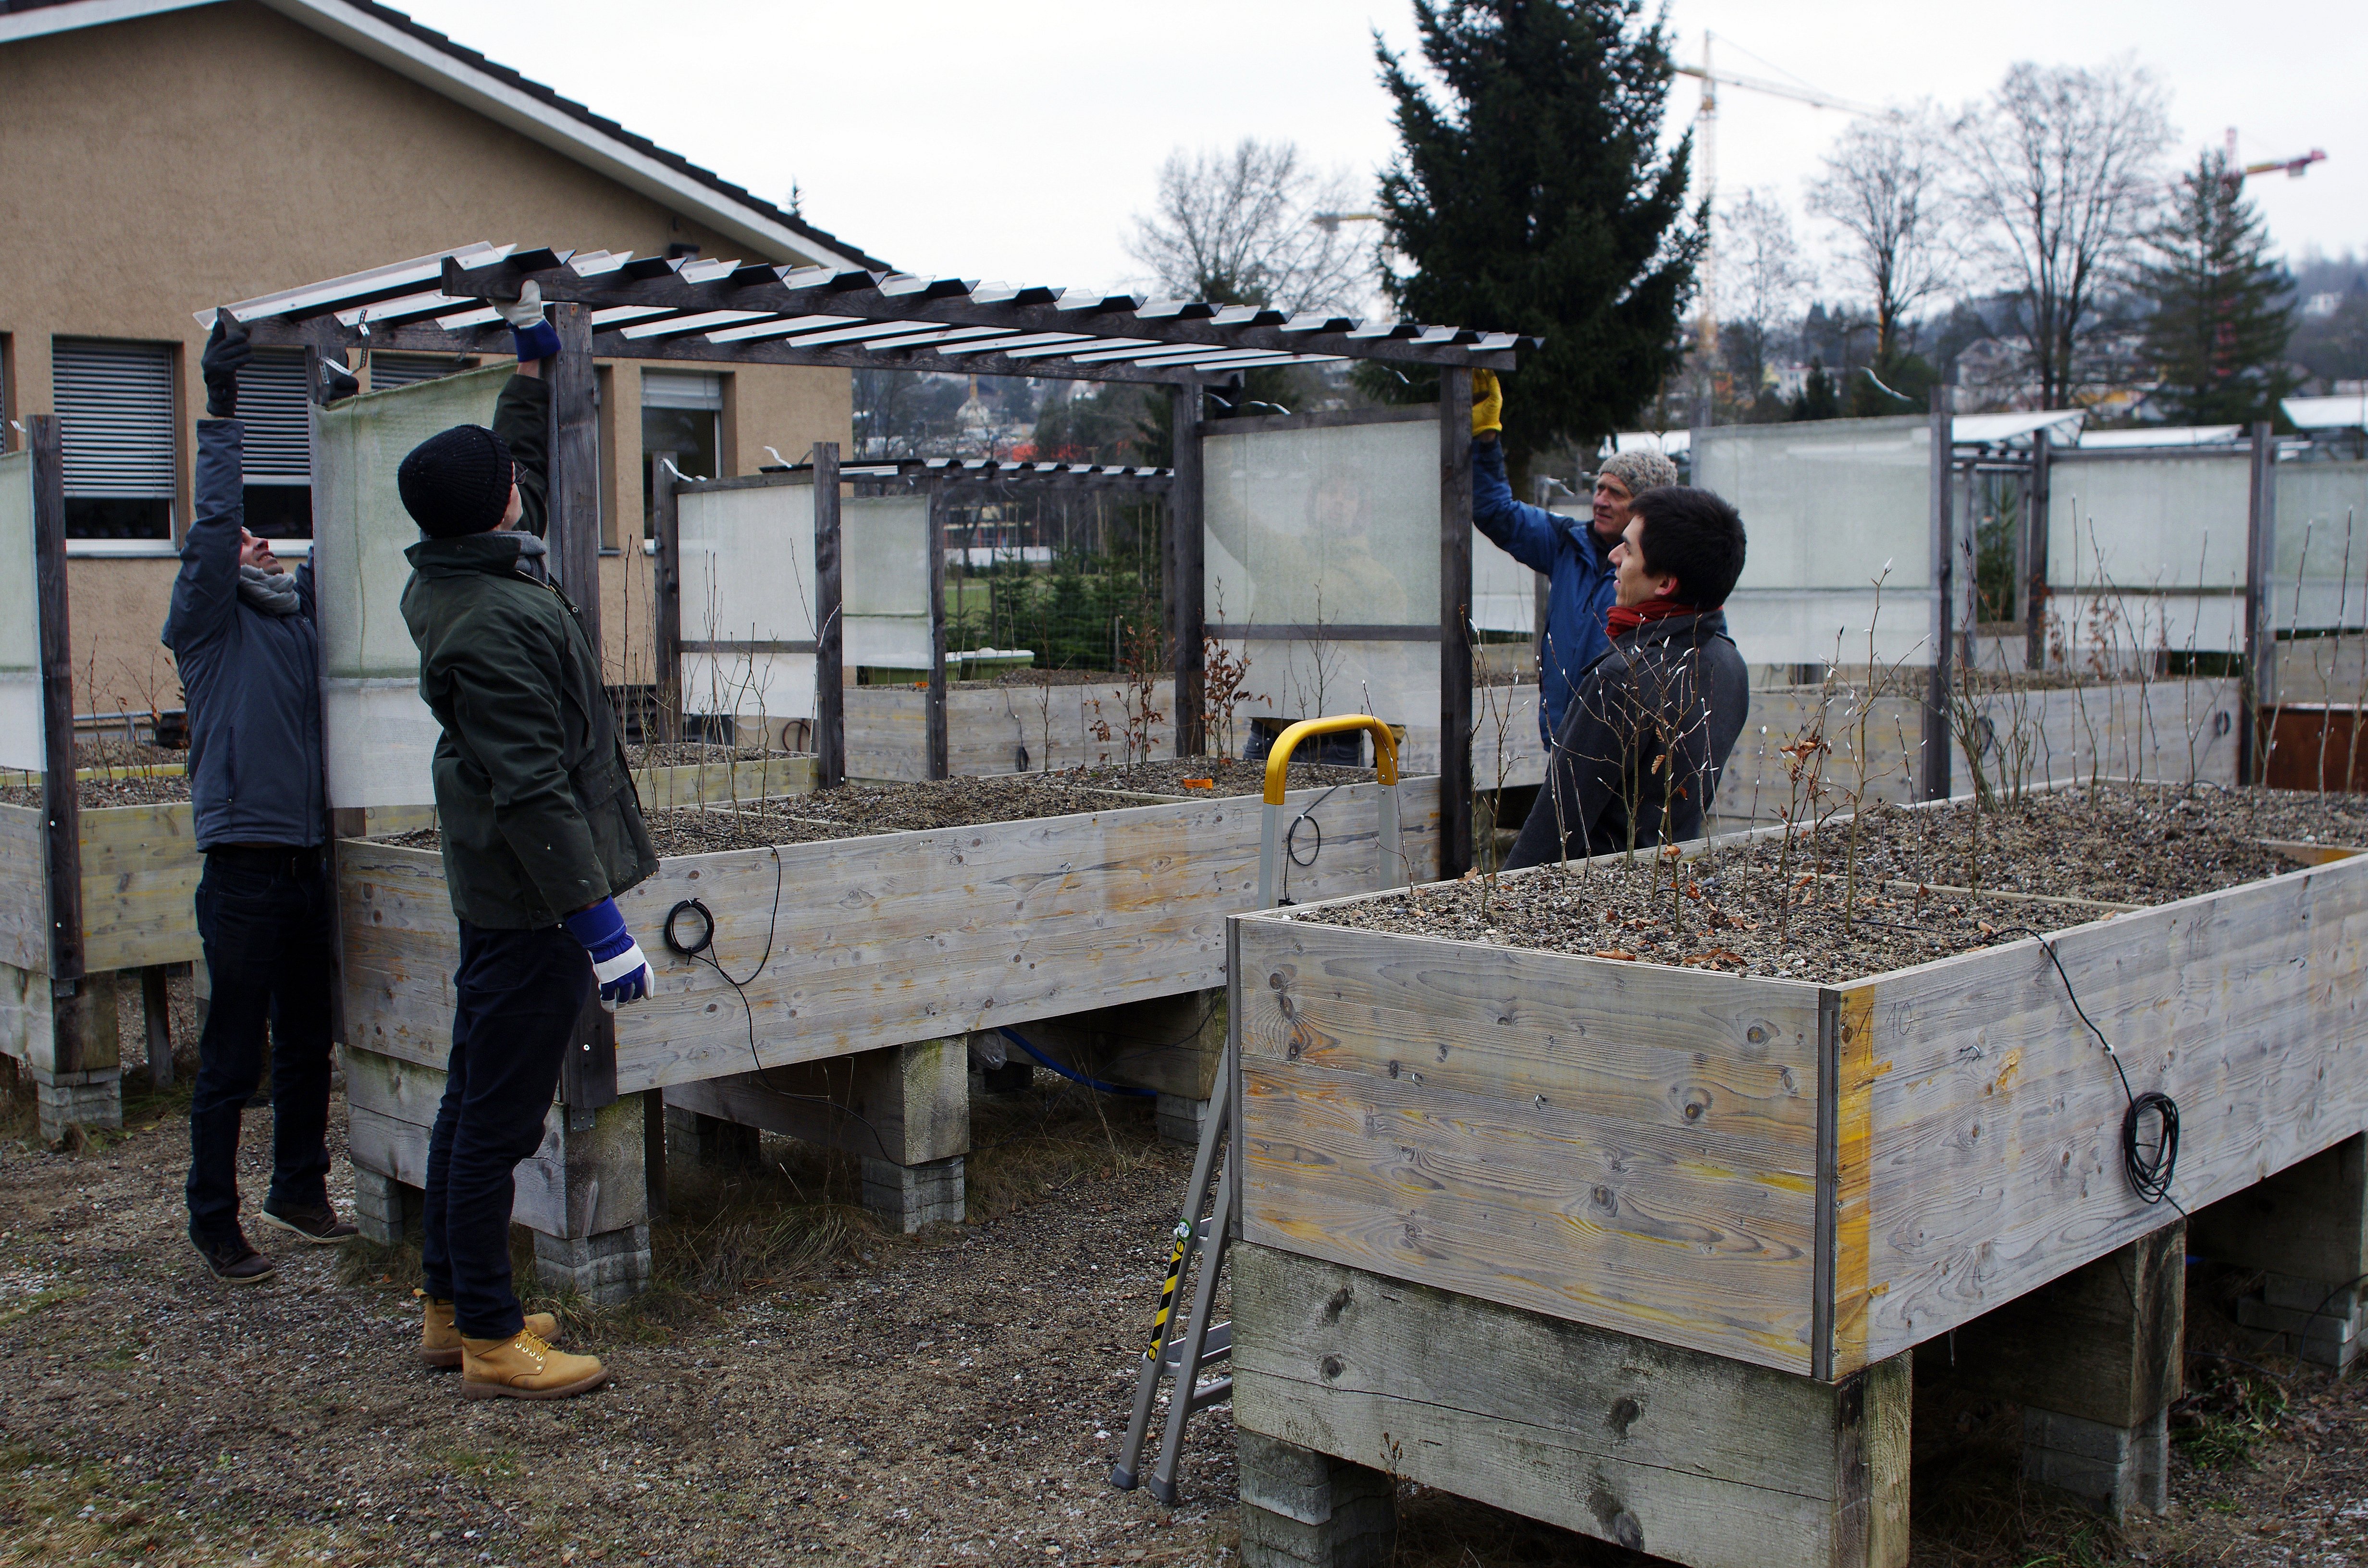
With my experiment I want to gain an insight into how the microclimate – namely the exact temperature inside the buds – affects the timing of leaf emergence in spring. The colour of the paint alters the ratio of reflected to incident light energy on the buds (albedo). And as one idea leads to another, I also fitted the wooden boxes with roofs to see how alterations in shade and precipitation would affect the date of leaf emergence the following spring. The wooden boxes contain saplings belonging to deciduous tree species commonly found in Switzerland, namely beech, oak, ash and cherry.

Image 1 of 9
Buds painted black or white. Photo: Ueli Wasem, WSL

Image 2 of 9
Overview of the experiment. Photo: Yann Vitasse, WSL

Image 3 of 9
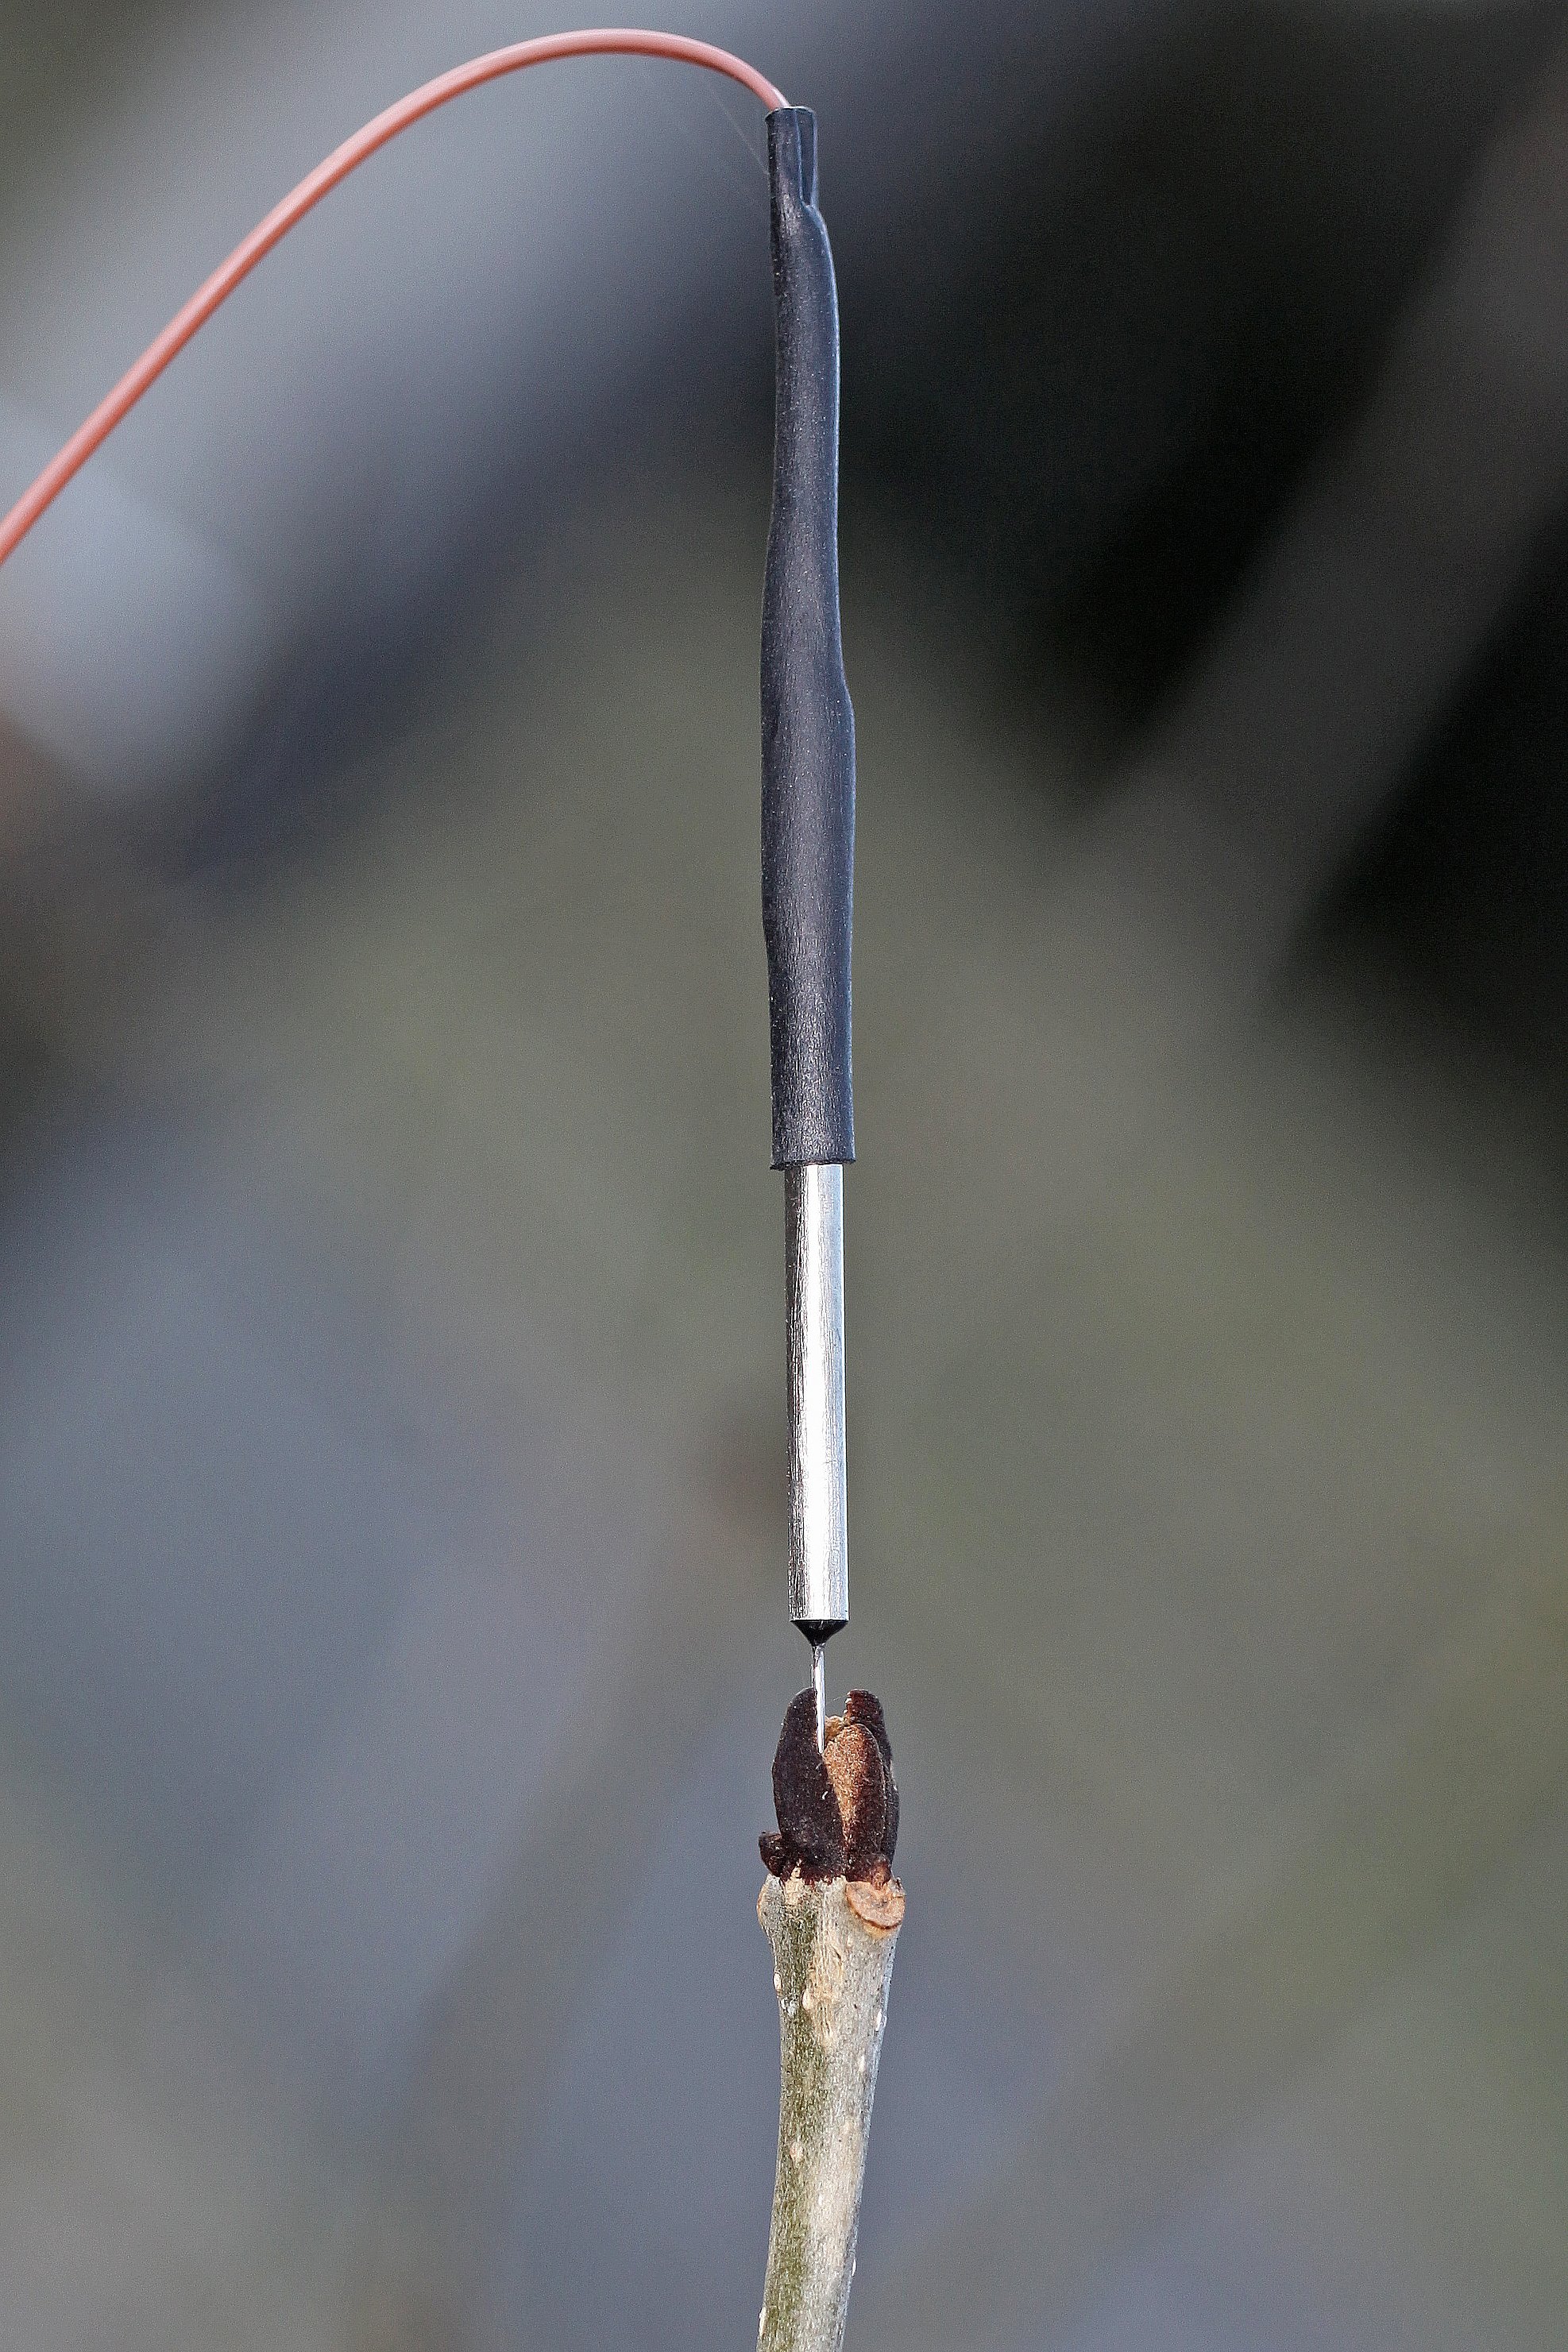
Temperature sensor in an ash bud. Photo: Ueli Wasem, WSL
. Photo: Yann Vitasse, WSL")
Image 4 of 9
Temperature sensor in a beech bud (painted black). Photo: Yann Vitasse, WSL

Image 5 of 9
Temperature sensor in a cherry bud that is breaking open (third stage of leaf emergence). Photo: Yann Vitasse, WSL

Image 6 of 9
Shading structure (before bud break / leaf emergence. Photo: Yann Vitasse, WSL

Image 7 of 9
Yann’s son Timéo lends a hand. Photo: Yann Vitasse, WSL

Image 8 of 9
Help with construction. Photo: Yann Vitasse, WSL
. Photo: Yann Vitasse, WSL")
Image 9 of 9
Installing precipitation-reducing structures (gutters). Photo: Yann Vitasse, WSL
Buds as living thermometers 


I see buds as living thermometers capable of perceiving even the smallest fluctuations in temperature. With this in mind, I inserted a total of 33 tiny temperature sensors, which look a bit like the needles used for blood tests, directly into the buds. They record the temperature every 10 minutes and send the data directly to a server. The results are astounding! For instance, we can see that the temperature measured in a black bud on a sunny day is up to 6 °C higher than the temperature in a white bud. More interestingly still, there is a temperature difference of around 3 °C between buds in the shade and buds in full sun [see graph].
In spring, I checked twice a week whether the buds had already opened and whether the bud’s colour, the shade or the reduced precipitation had affected leaf emergence. The results were completely in line with the temperatures that had been measured in the buds: leaves emerged earlier in buds that were in full sun or that had been painted black and not white.
These results may seem intuitive at first glance, yet differences in microclimate are often neglected: researchers in the field of phenology – a discipline examining how the start of plant growth is affected by the climate – generally use climate data recorded by standardised weather stations. However, these sensors are located two metres off the ground, shaded and ventilated, with the effect that the data can be quite far removed from the actual temperatures experienced by buds in winter and early spring, considering that most buds are located in full sun and 20 metres off the ground.
This project aims to work out a correction factor that can be used to adjust the standardised temperatures measured by conventional weather stations to reflect the temperatures actually experienced by buds in winter. This will enable us to improve our predictions of when trees’ leaves, influenced by climate change, will sprout in the coming decades. Such knowledge is crucial for a better understanding of how forests will be able to store carbon in the future, for instance.
Excitement and disappointment: all part of a day’s work for a researcher! 
As is so often the case with research projects, I did run into some setbacks. I was so excited at the prospect of collecting such large volumes of microclimate data that I forgot to check the storage capacity of the device I was using to record my observations. As a result, much of this information ended up getting deleted in the first winter of the project. I repeated the experiment the following year, backing up the data far more often. And now, thanks to input from a technician, I can even monitor the buds’ temperatures in real time on my computer, which I must admit makes it difficult to tear myself away from the screen!