What happens behind trees’ bark and how does this process interact with climate change?
Contents 
The role of plant growth 
The growth of plants plays a major role for life on Earth. It is the main process that generates biomass (net primary productivity). Growth influences the global carbon, water and energy cycles via the chemical reactions involved, which eventually affect the climate system. Wood, which is the product of secondary tree growth, is the main terrestrial biotic reservoir for long-term carbon sequestration, its formation consuming around 15 % of anthropogenic carbon dioxide emission each year. From the plants’ perspective, the woody structures facilitate water and nutrients transport, provide mechanical support and storage for carbohydrates, as well as water and defense compounds, allowing trees to correctly function within the range of local climate variability. Deeper understanding of intra-annual tree growth is key for addressing pressing research questions related to the short- and long-term impact of climate change (including extremes) on forest growth, vegetation dynamics and climate. Sound predictions of how growth will respond to climate change are therefore crucial.
The cambium "inside-out" 
However, hidden behind the bark, the thin layer of actively dividing cells called “cambium” cannot be easily observed. This is where the seasonal dynamics of woody biomass production takes place. Therefore, our understanding of this key component of the carbon cycle, its sensitivity to climate, and its influence on the functioning, resilience and species distribution of trees remains very limited.
The study of xylogenesis, i.e. the process of xylem formation carried out by woody plants (see Rathgeber et al. 2016 for a crash course), allows to virtually turn the inner bark surface outwards and observe the formation of both xylem and phloem. Studying these processes taking place in tree stems in relation to the simultaneously occurring environmental conditions allows for fine-scale investigations of plant response to environmental variation. This has direct implications for regional climate, carbon uptake, biodiversity, and society.
Observing to understand and predict 
Monitoring tells us what is happening, research tells why something is happening, and modeling helps to tell us what can happen. The Lötschental is the ideal research setting to combine the three approaches around this fundamental and environmentally sensitive process of “secondary growth”.
The short film gives a fascinating insight int the natural museum the Lötschental is and illustrates our methods in trying to understand the wooden witnesses of the past.
The Lötschental tree-growth monitoring Transect 
In order to further understand and perhaps predict the effects of the projected temperature increase in forest ecosystems, the Dendrosciences group of the WSL is monitoring forest growth along both the south and north facing slopes of the Lötschental valley. The Lötschental monitoring transect is an ensemble of 9 tree-growth monitoring sites distributed along an elevational gradient from 800 to 2200 m. a.s.l. The setting (Figure 2) was installed in fall 2006 and includes infrastructure to investigate continuous stem growth of mature Picea abies and Larix decidua trees grown under natural conditions. The originality of the setting relies on long-term monitoring of xylogenesis (wood formation) by means of weekly stem tissue sampling (Figure 3), in parallel with sub-hourly measurements of radial growth, sap flow, air and soil temperature, relative humidity, soil water content, soil matrix potential, and solar radiation at each site (Figure 4). These data have occasionally been complemented with additional measurements to characterize isotope signals in soil and tree compartments, tree phenology, the dynamics of non-structural carbohydrates in the cambium, trees’ genomic DNA, and tree-ring width and wood anatomy.

Image 1 of 3
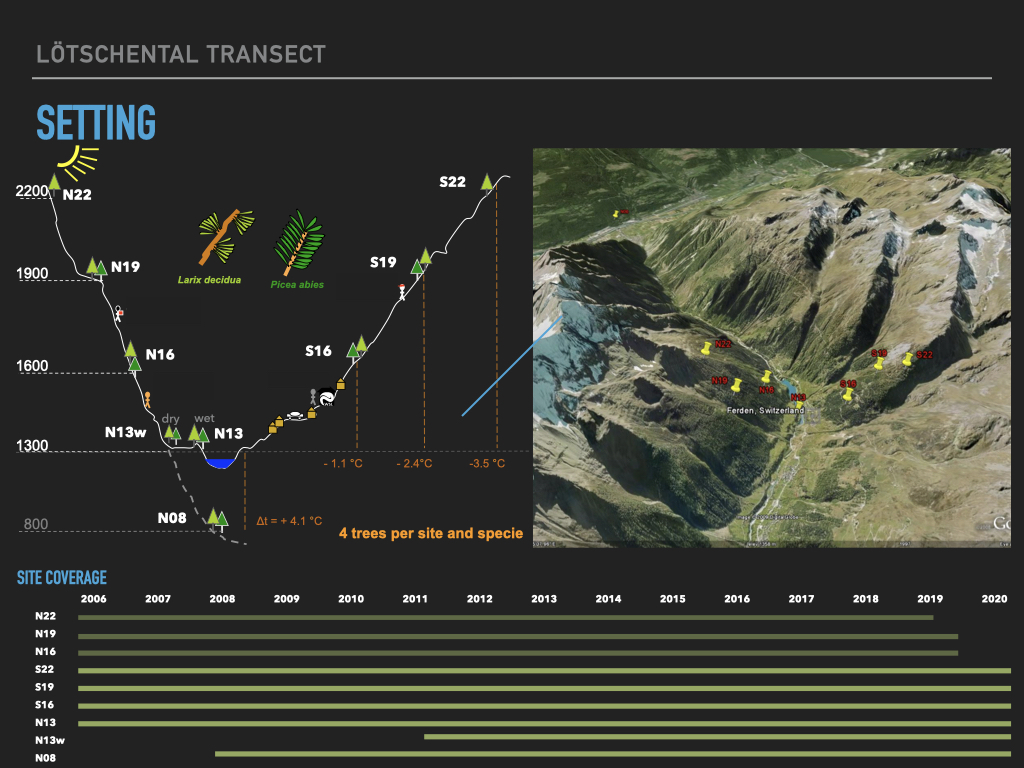
Figure 2: The setting of the Lötschental monitoring transect. The setting, initiated at the end of 2006, consists of a total of nine tree-growth-monitoring sites positioned in the landscape in order to optimally cover an ecological (elevational) gradient. Starting from the valley bottom at 1300 m asl (N13), the sites spread at every 300 m gain in elevation along both the sun-facing (S) and north-facing (N) slopes up to the forest limit at 2200 m asl (S22 and N22). In 2008 an additional site has been added at 800 m asl in the main Rhone valley close to Gampel (N08) to extend the elevational gradient toward its warm and dry end. In 2012 an additional wet site has also been added to contrast a dry site at the valley bottom (N13W). In 2019 the three highest sites on the north facing slopes (N16, N19, N22) have been dismantled to focus resources on the road accessible sites on the south slope. The average growing season temperature difference between the closely located extreme of the elevational gradient is of about 7 °K.
At each site we have been monitoring the growth physiology with dendrometers on mature and dominant trees (4 Larix decidua and 4 Picea abies), with the exception of the highest forest limit sites, where Picea does not occur, and at N13w where only three trees per species were selected. Additionally, each site has been equipped with several sensors to monitor the local conditions. These usually includes air and soil temperature, relative humidity, soil water availability. Except for the three sites on the upper north slope, all the other sites have also been equipped with sensors to measure sap flow (in 2012) and soil matrix potential (in 2014). Currently, we have more than 14 years of high-resolution growth-physiology related data for two species and covering a 1400 m elevational gradient.

Image 2 of 3
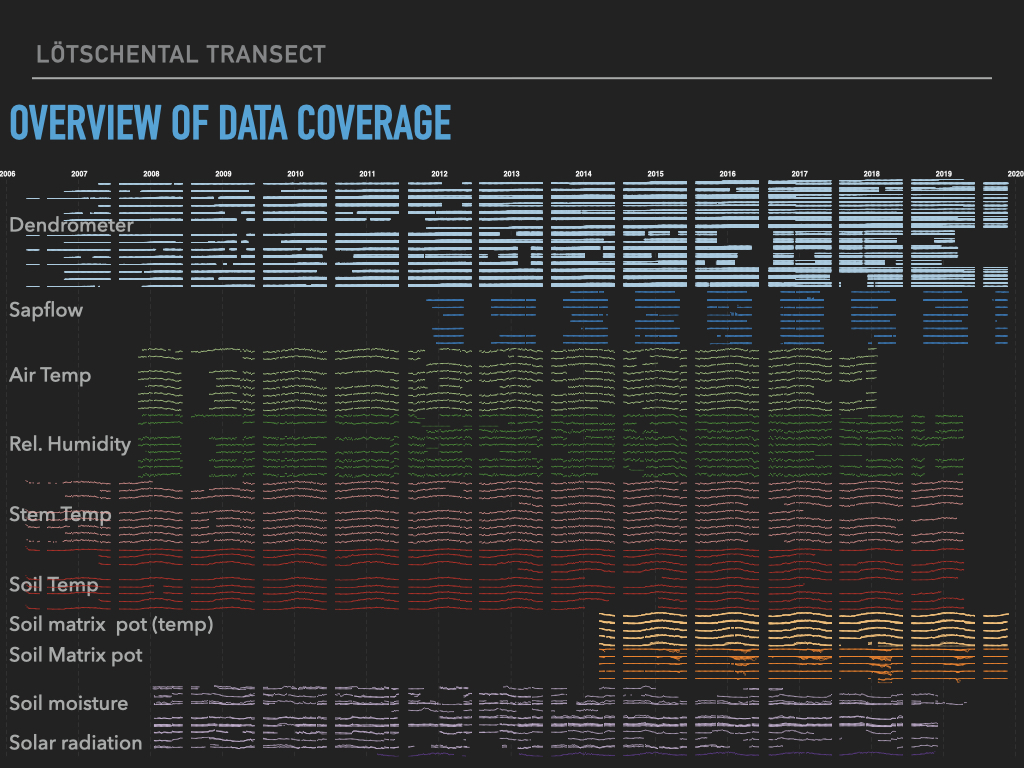
Figure 3: Overview of instrumental data from the Lötschental monitoring transect over the last 14 years. Each color indicates a data category and each line refers to a single site. Gap in the lines indicates for missing or discarded data due to insufficient quality. Each site can include more sensors. This figure shows the dynamic development of the setting. The project started in 2006 with few dendrometer and temperature logger. More loggers and data type have been progressively added over time. In 2019, the were a total of 63 individual loggers of 6 different types, showing the increasing complexity of data collection and curation. In 2019 the setting has been reduced from 9 to 6 sites to reduce workload.

Image 3 of 3
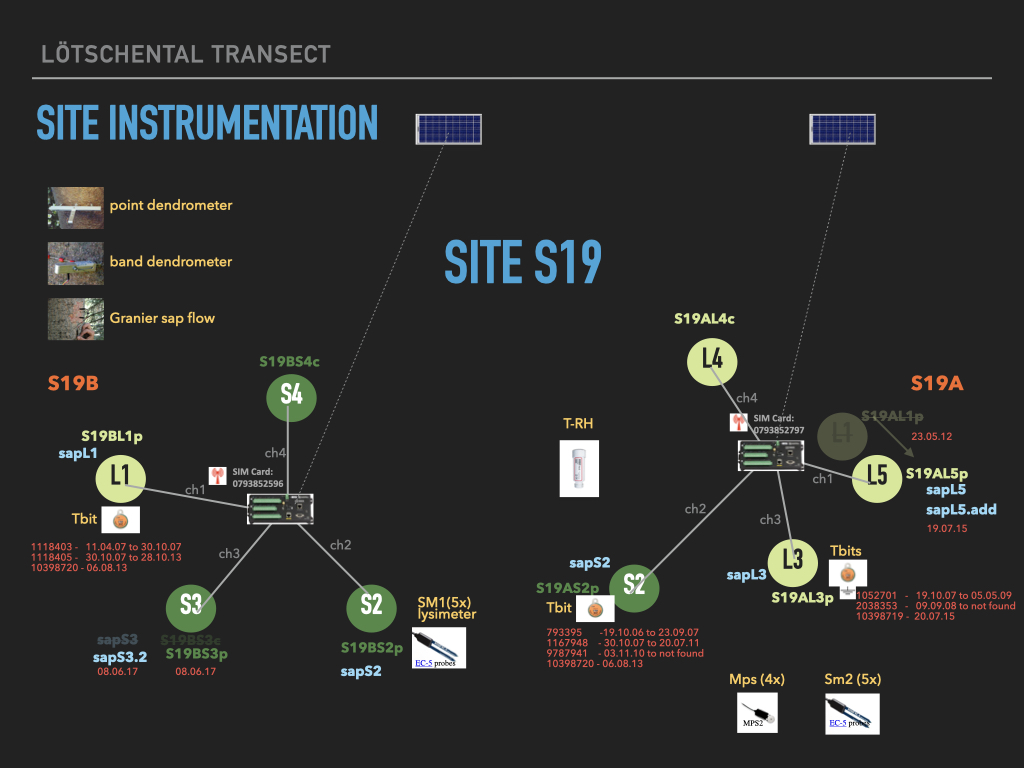
Figure 4: Example of the instrumentation at a site. Eight trees (colored circles), 4 for each species (L = Larch, S = Spruce) are monitored. A Campbell CR1000 datalogger collect sapflow (6) and dendrometers (8) data a 15’-resolution from a cluster of four trees and the data are sent to the server at WSL via a CDC modem. Each Campbell logger is in turn connected to a solar power source. Additional logger collects site environmental information at the same time resolution. These includes Tbit temperature loggers (3), Lysimeter for soil moisture (2*5), MPS for soil matrix potential (4) and Hobo T-RH logger (1) for site temperature and relative humidity. Colored labels indicate the tree (circled labels) or the sensors (greenish are the dendrometers and blue are the sapflow, orange the environmental sensors), while the red dates indicates a change in the timeseries either due to a change of tree or of sensor.
Contribution and outputs 
The project has a modular and open structure. This means that there is a given general setting (site selection and basic measurements such as ground temperature) to which other specific research questions can be added. The project started in 2007 and is still ongoing. Since its installation, the tree-ring transect has contributed to numerous scientific publications (see publication list below) that address research questions on various aspects of the tree growth process.