

A biodiversity dashboard for Switzerland
2025 - 2026
Cooperation FinancingBackground 
Rapidly growing biodiversity databases and advances in machine learning have enabled a new generation of versatile species distribution models with high spatial and temporal resolution. Their complexity opens up a broad range of potential applications, but also poses challenges for making them accessible to users. We are developing a web application that makes the capabilities of such modern models directly available to a broad user community.
Specifically, we are collaborating with InfoFlora, info fauna, and SwissFungi to design an accessible web interface that combines three approaches:
- Nationwide maps of key biodiversity statistics, optimized for large-scale overviews
- A dynamic application interface for highly flexible, small-scale queries, allowing users to retrieve predictions for specific species at selected locations and over selected time periods
A simulation tool that allows users to simulate environmental changes at a given location and assess their effects on species observation probabilities
Designed as a permanent, modular infrastructure, the Swiss Biodiversity Dashboard can integrate a range of models covering different taxonomic groups and spatio-temporal extents, while enabling efficient model updates and extensions.
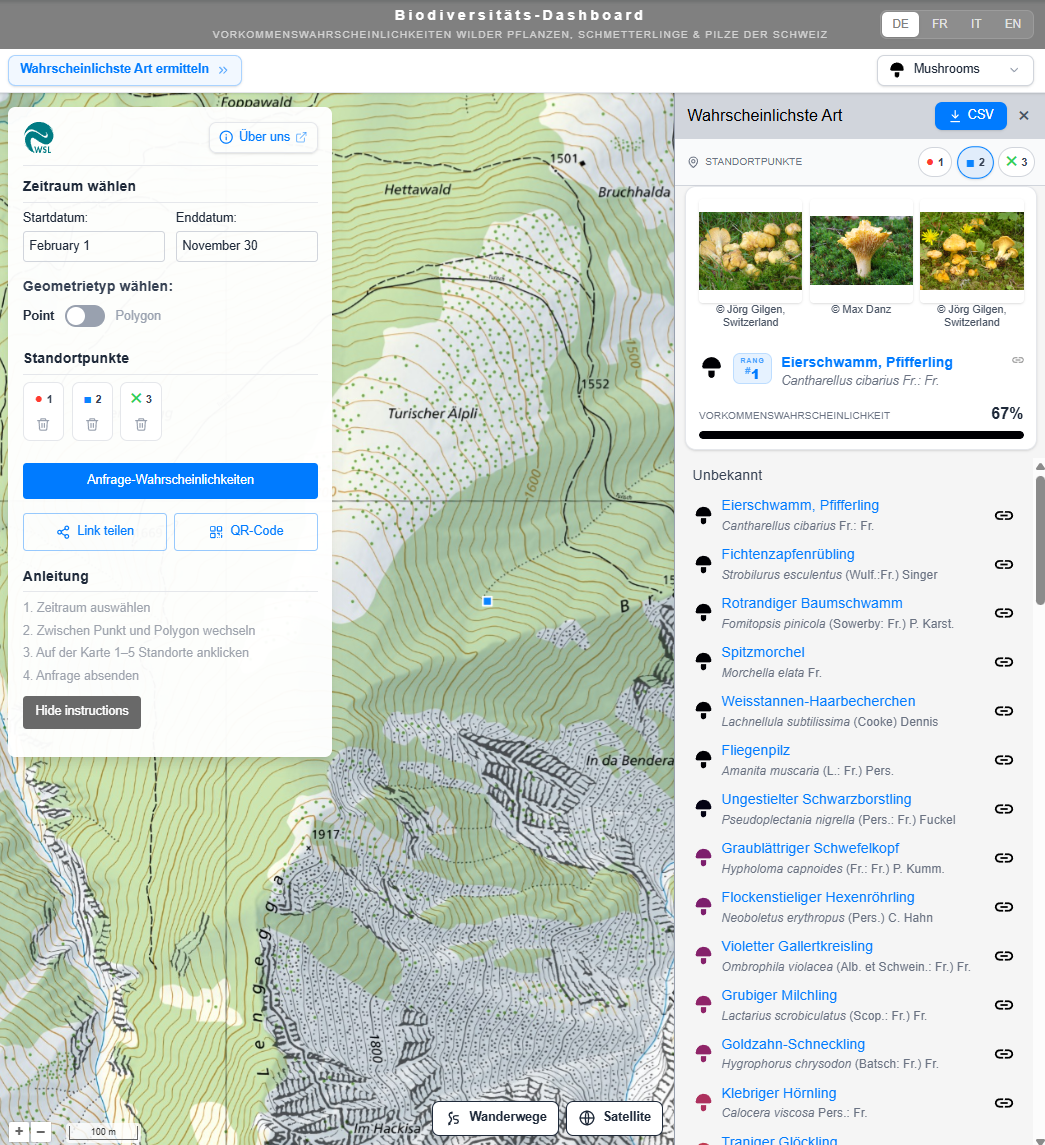
How it works 
The current capabilities hosted by the dashboard and introduced in the videos below are the following:
- Finding the most probable species for a selected point or polygon
- Inspecting seasonal patterns in observation probabilities for species at a selected point
- Inspecting spatial patterns in observation probabilities for species within a polygon
- Simulating how environmental change (meteorology, land use and vegetation) affects observation probability, utilizing highly granular environmental and satellite data